Three Dimensional Visualization of the World Wide Web
Email: sdb@cs.nott.ac.uk
Introduction
Although large-scale public hypermedia structures such as the World Wide Web are popularly referred to as "cyberspace", the extent to which they constitute a space in the everyday sense of the word is questionable. This paper reviews recent work in the area of three dimensional (3D) visualization of the Web that has attempted to depict it in the form of a recognizable space; in other words, as a navigable landscape that may be visibly populated by its users. Our review begins by introducing a range of visualizations that address different aspects of using the Web. These include visualizations of Web structure, especially of links, that act as 3D maps; browsing history; searches; evolution of the Web; and the presence and activities of multiple users. We then summarize the different techniques that are employed by these visualizations. We conclude with a discussion of key challenges for the future.Visualizing the structure of the Web
Various visualizations have been developed to show the structure of a region of the Web. These are intended to provide users with 3D maps to guide browsing. Common assumptions behind these visualizations are that 3D interfaces may be capable of displaying a larger volume of information in a single display than 2D, and that users may more easily learn the structure of the Web as a result of flying though a 3D landscape [Benford 1996].Perhaps the most obvious representation of Web structure is as a graph of nodes connected by links. Natto [Shiozawa 1997] visualizes a number of Web pages by drawing such a node/link graph that is initially distributed on a flat horizontal plane. The placement of the nodes is dictated by attributes of the Web page (e.g. its size, title, number of images) which are mapped to the two-axis of the plane. The user may select nodes and raise them vertically to de-occlude the structure. Adjacent (linked) nodes maintain a close proximity to the raised nodes so that the structure is gradually "disentangled" from the plane. Figure 1 shows a typical result of this process. Natto demonstrates a method of de-occlusion by manual control, however, there are limits to the number of nodes that may comfortably occupy the flat plane before selection becomes difficult. Also, the range of pages is fixed when the visualization is generated.
Figure 1: A selection of pages in Natto.
Narcissus [Hendley 1995] also produces a graph-like representation. Occlusion is automatically reduced through the metaphor of attractive and repulsive forces. Web pages (nodes) exert repulsive forces on each other, whereas the links between them lead to attractive forces. Simulating these forces results in tightly inter-linked sets of pages being grouped into spatial clusters within the visualization. Figure 2 demonstrates a resulting graph.
Figure 2: Web site visualisation with clustering in Narcissus.
Although occlusion can still occur, the problem of two objects occupying the same space at the same time is eliminated. An additional scaling mechanism is offered by agglomerating clusters into a single, identifiable object. Narcissus does this by surrounding clusters with a translucent surface to effectively remove most of the detail.
An alternative approach has been demonstrated by Munzner and Burchard [Munzner 1995] in the construction of three-dimensional hyperbolic space that supports "focus + context" exploration of hypertext structure. The hyperbolic space is formed inside a sphere whose surface is conceptually an infinite distance from the centre. Nodes close to the centre of the sphere appear large and it is here that the focus is achieved. Figure 3 provides an example of this layout for several WWW pages.
This work is similar to that of Lamping et al. [Lamping 1995] but adds a third dimension with the intention of allowing a higher information density within the space.
Figure 3: Hyperbolic layout of a number of pages.
In the HotSauce [HotSauce 1999] Web browser from Apple Computers the links are implicit. The HotSauce browser represents Web pages as floating text labels in a 3D space. Pages at the higher level of the hierarchy in a Web server appear large in the foreground whilst the next level would be further away, distributed evenly in the background of their parent page label. The user can "walk" through the labels, progressively bringing lower levels into the foreground. Labels can be repositioned or selected to invoke the content. Figure 4 contains an initial HotSauce view of the Apple Computer Web site.
The Perspecta SmartContent [SmartContent 1999] viewer adopts a similar approach to HotSauce with the addition of link representation. It also allows the user to move the viewpoint into the page hierarchy to reveal detail at lower levels.
Figure 4: Pages as viewed in the HotSauce Browser
Two further visualizations of Web structure move away from a graph like representation.
The Open Text Web Index visualization [Bray 1996] visualizes several variables associated with Web sites. Parameters such as number of pages, number of links to and from these pages, and domain identifiers, define a composite object that is placed in a 3D space. Such objects combine distinct visual components to represent information around a single unit, i.e. the Web site. The distance between them is determined by the degree of connectivity between the two sites. A view of these sites is shown in figure 5. The lack of detail in the visualization prohibits its use as a page browser but acts as a map at the site level.
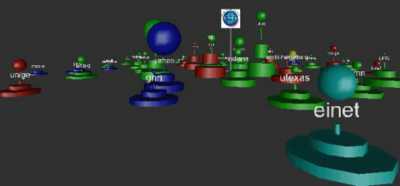
Figure 5: A view of the web generated from the Open Text Web index.
MAPA [Durand 1998] is a visualization that aims to improve navigation in large Web sites of between 500 and 50,000 pages. MAPA presents pages as square icons that stand in rows and columns on a flat plane. A focus page is placed at the front edge of the plane and its child pages form a row behind the focus page. Each child page then has its children behind it so as to form a single column behind the page. Essentially, this aims to provide a layout mechanism with minimal visual clutter. Figure 6 demonstrates this layout with a view of the pages within a company Web site.
Figure 6: A Web site viewed in MAPA.
Visualizing browsing history
Although they share many common techniques with the systems described above, visualizations of browsing history provide images of where the user has been as opposed to maps of where they might go.WebPath [FrČcon 1998] generates a three-dimensional representation of a Web browsing history within the DIVE distributed virtual reality environment. WebPath runs alongside a conventional browser and is updated whenever a page is visited. Each page is represented as a cube upon which one of three page properties is displayed (the page background image, the first image in-lined in the HTML or the page background colour). The vertical position of the cube is incremented at each visit so as that the most recently visited cube is at the highest point. Semi-transparent layers divide the space so that the older pages gradually become more obscure due to a fogging effect. This effect can be seen over a number of successive layers in figure 7.
Figure 7: Browsing history as depicted by WebPath.
The horizontal position of the cube can be determined dynamically during run-time, either by mapping the horizontal axes to two of a possible eight metrics (e.g. loading time, number of images, sever name) or geographically over a world map. Also, successive pages are linked by directed arcs. All visited pages result in a new cube, irrespective of whether they have been previously visited. WebPath also extends a web history by allowing dynamic querying using three variables. However, the tool acts as a reminder to already viewed pages rather than as a guide to undiscovered regions of the Web.
The WebForager and the WebBook [Card 1996] are two related designs that were born out of the observation that the Web does not provide a particularly sophisticated information workspace. In particular, current Web browsers provide only limited support for personalisation through the use of bookmarks, and even these become difficult to work with when composed of many entries. Also, the use of a window for a single Web page inhibits smooth interaction with multiple pages. Their method of enhancement is to gather related pages using a book metaphor (the WebBook) and to place both books and pages in a dynamic workspace termed the Web Forager as seen in figure 8. The Web Forager was designed to scale the space for, and provide rapid interaction with, many pages. In addition to the page and book metaphor, a "bookcase" is provided to allow a further level of aggregation. Although the workspace enhances interaction with a number of Web pages, there is no visual representation of Web structure and meta-data.
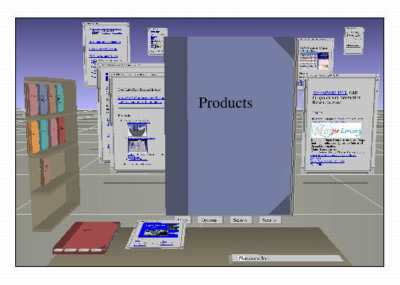
Figure 8: A WebBook in the foreground of the Web Forager. (Image copyright © 1996 Association for Computing Machinery)
WWW3D incrementally constructs a 3D map of the user's current browsing session so that they see each new Web page within the context of those that have already been visited [Snowdon 1997]. It adopts the graph-like approach where each page is represented as a sphere with hyperlinks being represented by arrows between the spheres. An incremental version of Fruchterman and Reingold's Force Directed Placement (FDP) algorithm [Fruchterman 1991] (a force simulation algorithm) is used to dynamically regenerate the layout of this map so as to take account each new page and any additional cross links that are encountered. Figure 9 shows an example of a browsing session in WWW3D.
Figure 9: A browsing history in WWW3D.
As a further note, the LEADS system [Ingram 1996], is a meta-visualization tool to enhance the legibility of information visualisations - i.e., the ease with which users may learn to navigate their structure during a repeated series of visits. Based on Kevin Lynch's observations on the legibility of physical cityscapes, LEADS automatically enhances visualizations with legibility features such as distinct districts, landmarks, edges, nodes and paths. One demonstration of LEADS involved enhancing the output of WWW3D in order to make the browsing history more legible.
WWW3D suffers from several limitations. Scalability is limited due to the demands of the FDP algorithm; the layouts produced are difficult to read, especially where there is complex inter-linking between pages; and it only shows a history of where the user had been, with no indication of where they might go. The HyperVIS system is a successor to WWW3D that attempts to address these problems and that also combines mapping and visualising browsing history [Brown 1996]. HyperVIS displays a browsing history as a 3D graph, but also continually maps out a region of the Web in advance of the user's current position. The extent of this forward mapping can be limited by a user-specified scope that combines a maximum search depth, maximum number of pages to be considered and various filters that can be applied against URLs. These filters include the ability to limit the mapping to the contents of specific servers or even directories within servers. To aid scalability, the visualization is based upon a hierarchy of regions. Each region can be folded or unfolded according to the user's level of interest or proximity. Each region can also use a locally defined visualization algorithm to present its contents, supporting visualisation styles beyond 3D graphs such as cone-trees. A further aid to scalability is a link aggregation algorithm that shows many individual links between two clusters as a single arrow of an appropriate thickness.
Visualizing the evolution of the Web
In contrast to the previous visualizations of a single user's browsing history, the Time Tube [Chi 1998] visualises the evolution of a Web site over a period of time. Various attributes of the site such as frequency of access, paths taken by browsers, and the age of its information are mapped to a disk tree visualization. This is formed by drawing the tree structure of the site as a disk shape in which the centre is the root page and hyperlink trees branch out around the root. A number of disks are presented in parallel along a time axis forming a time tube, thus demonstrating the evolution of the Web site over time. Figure 10 shows a tube formed by four disk trees resulting from weekly sampling over a period of one month. The user can interactively extract slices from the tube and rotate the tube. They can zoom into each slice to reveal greater detail. A conventional Web browser can also be invoked to view specific pages of interest. The Time Tube is of particular use when temporal qualities of hypertext structures are to be revealed and analysed.
Figure 10: A Time Tube formed by the evolution of a Web site in four weekly increments.
Visualizing Web searches
When searching the Web, the user typically enters one or more keywords and in return is presented with a list of matching pages, rank ordered according to how well they match. It may be difficult for the user to compare the results returned by different queries in order to home in on pages that match successive or multiple combinations of keywords. VR-VIBE is a 3D interactive visualization that enables users to dynamically compare the results of multiple search queries [Benford 1997]. VR-VIBE is based on an earlier 2-D system by Olsen et al. called VIBE [Olsen 1993] and works as follows:- the user enters a number of queries, each consisting of several keywords.
- each query is assigned a position in 3D space, either directly by the user by dragging it or automatically by the system.
- VR-VIBE matches each page in its local catalogue against each query, resulting in a score that represents the relative attraction of that page to that query. From this, the overall relevance of a specific page to all of the queries can be calculated (the sum of all scores for this page), as can the overall significance of each query (the sum of all scores across for this query).
A 3D representation of the search space is constructed as follows. An icon representing each matched page is located at its relative centre of attraction to all of the currently active queries. Thus, a page which is attracted to only one query will be located next to that query, whereas a page which is attracted to several queries will be located somewhere between them, with its exact position depending on the relative strengths of the attractions. It is as if the queries exert a gravitational pull on the pages. The overall relevance of each page is mapped onto the size and shade of its icon; the bigger and brighter it is, the greater the overall relevance to all of the queries. Similarly, the overall significance of each query is mapped onto its brightness; thus, the brighter it is the greater its "pull" on the pages in the space. The resulting 3D visualisation gives the user a sense of which pages are generally interesting (big and bright ones) and also which pages are most relevant to which specific keywords (spatial position).
Figure 11: Visual searching with VR-VIBE.
An important aspect of VR-VIBE is the way in which users can dynamically manipulate the visualisation. They may fly through the 3D scene in order to home in on specific areas or zoom out for an overview. They may select pages in order to retrieve their contents. They may select queries in order to activate or de-activate them. They may dynamically add new queries. They may reposition queries by dragging them or asking the system to "tidy" them into a sensible configuration. Finally, they may use a relevance filter widget to cull all pages whose overall relevance falls below a set threshold. Figure 11 shows a screen shot from VR-VIBE. Five queries (octahedra) are arranged as a pyramid and 1500 documents (blocks) are stretched between them. The relevance filter (vertical bar with slider) can be seen towards the bottom left as can representations of several other users (see following section).
Visualizing the users of the Web
Although a hypertext may be shared by many users who are simultaneously accessing its pages and links via a common server, hypertext implementations tend to treat users as something that are outside of the system. An alternative approach is to consider users to be an integral part of the hypertext and to make their presence and actions visible to one another, as they would be if they were browsing books in a library or posters in front of a notice board. Several 3D Web visualisations have included representations of users, either so that they may work together, for example collaboratively browsing and searching, or so that the hypertext becomes a meeting place where encounters between people with similar interests can occur.One approach is to create the visualizations using the technology of collaborative virtual environments, distributed multi-user virtual reality systems that support co-operation [Benford 1995]. In this case, several users may share the same visualization, for example a 3D map. Each user independently controls their own viewpoint and is represented to others through a graphical embodiment called an avatar that indicates who they are and what they are looking at within the visualization. Users may also communicate with one another using a combination of text chat, real-time audio, video views that are embedded within the visualization (e.g., as faces on avatars) and avatar gestures. Several of the visualizations described above support this kind of multi-user access including WWW3D, VR-VIBE, WebPath and HyperVIZ. Figure 12 shows an image from the WWW3D system in which several users can be seen clustered around different nodes in a 3D Web map.
Figure 12: representing 2-D users in WWW3D.
The Information Garden [Crossley 1997] is a shared visualization of information provided by the Jasper Internet indexing tool. The 3D visualization is pre-prepared (as opposed to being dynamically created) and is based around a circular structure that is divided into two main areas. The centre contains a forum in which users can meet and communicate using various media including text, audio and video. Surrounding this area are information structures or "plants" that visually represent document clusters. Each plant is formed by a central stalk, from which documents radiate as stalks. Each stalk has a color coded square on its end to represent the status of the document (e.g., dead link, updated since visited). Users can bring their own information into the shared space or take "cuttings" from the plants to develop personal copies.
Figure 13: The Information Garden.
One distinction between these various approaches is whether the users are located in a shared Cartesian space (i.e., they see the same 3D visualization, albeit from different perspectives) or whether they each see their own subjective visualization with the relative positions of other users being indicated by avatars. WWW3D, VR-VIBE, WebPath and the Information Garden adopt the former approach. HyperVIZ adopts the later, showing other users' avatars as facing the page on which they are currently focusing.
Once again, scalability is a problem, this time in coping with a large number of simultaneous users. One potential solution has been demonstrated by an extension to WWW3D in which a Web page or small group of Web pages can be treated as a sub-region. Users can communicate with others in their current region (page or site) and may be visually aware of the presence of other users in enclosing or nearby regions [Snowdon 1997].
Our final example of visualising the users of a hypertext involves creating persistent and open connections between information on the Web and the physical world. In the Internet Foyer [Benford 1995], a 3D visualisation of an organisation's home pages, complete with their current visitors, is projected into its physical reception area. At the same time, visitors to the visualisation arriving over the network see a live video view looking out into the reception area. Given an open audio link between the virtual and physical spaces, visitors to the home pages are able to communicate with those in the reception area, creating an single entry point into the organisation's physical and electronic spaces.
Summary
We have surveyed different approaches to creating 3D visualizations of the World Wide Web. These have spanned visualizations of the structure of the Web, the history of browsing sessions, searches, the evolution of the Web, and the presence of other users on the Web. Between them these visualizations have introduced a range of visualization styles and techniques to manage scalability, interaction and information sharing.At present, most of the work in this area is focusing on demonstrating new approaches and techniques and there is little widespread experience with them or evidence for their effectiveness. Trials and evaluation are very much a priority for future work. However, what is clear is that these approaches share a common vision - the idea of transforming the from being a structure that is experienced on page at a time through a 2D browser to being a structured space that may be navigated and potentially populated by many users.
Acknowledgements
We would like to acknowledge the owners for their permission to reproduce the images contained in this paper.References
[Benford 1995] Steven D. Benford, David Snowdon, Chris M. Greenhalgh, Rob J. Ingram, and Ian Knox. "VR‚VIBE: A Virtual Environment for Co‚operative Information Retrieval" in Computer Graphics Forum, 14(3), NCC Blackwell, [16], 1995.[Benford 1996] Steven D. Benford, Chris C. Brown, Gail T. Reynard, and Chris M. Greenhalgh. "Shared Spaces: Transportation, Artificiality and Spatiality" in Proceedings of ACM CSCW '96, Boston, MA 77-86, [18], 1996.
[Benford 1997] Steven D. Benford, David N. Snowden, Chris C. Brown, Gail T. Reynard, and Rob J. Ingram. "Visualising and Populating the Web: Collaborative Virtual Environments for Browsing, Searching and Inhabiting Webspace" in Computer Networks and ISDN Systems, 29, pp. 1751‚1761, Elsevier, 1997. First appeared in Proc. JENC'8 (8th Joint European Networking Conference), Edinburgh, UK, May 12-15th, 1997.
[Bray 1996] Tim Bray. "Measuring the Web" in Proceedings of Fifth International World Wide Web conference, Paris, France, 993-1005, May 1996.
[Brown 1996] Chris C. Brown and Steven D. Benford. "Tracking WWW Users: Experience from the Design of HyperVIS" in Proceedings of WebNetĽ96: World Conference of the Web Society, 57‚62, San Francisco, CA, Association for the Advancement of Computing in Education, [14], October 1996.
[Card 1996] Stuart K. Card, George G. Robertson, and William York. "The WebBook and the Web Forager: An Information Workspace for the World-Wide Web" in Proceedings of ACM SIGCHI '96, Vancouver, Canada, 111‚117, April 1996.
[Chi 1998] Ed H. Chi, James Pitkow, Jock D. Mackinlay, Peter Pirolli, Rich Gossweiler, and Stuart K. Card. "Visualizing the Evolution of Web Ecologies" in Proceedings of ACM SIGCHI '98, Los Angeles, CA, 400‚407, April 1998.
[Crossley 1997] Martin Crossley, John Davies, Rob Taylor-Hendry and Andy McGrath. "3D Internet Developments" in BT Technology Journal, 15(2), 179, April 1997.
[Durand 1998] David G. Durand and Paul Kahn. "MAPA: A System for Inducing and Visualizing Hierarchy in Websites" in Proceedings of ACM Hypertext '98, Pittsburgh, PA, 66-78, June 1998.
[FrČcon 1998] Emmanuel FrČcon and Gareth Smith. "WebPath ‚ A Three‚Dimensional Web History" Proceedings of IEEE Symposium on Information Visualization (InfoVis ĺ98), Chapel Hill. NC, 3-10, [9] , 1998.
[Fruchterman 1991] Thomas M. J. Fruchterman and Edward M. Reingold. "Graph Drawing by Force Directed Placement" in Software Practice and Experience, 21(11), 1129-1164, November 1991.
[Hendley 1995] Robert J. Hendley, Nicholas S. Drew, Andrew Wood, and Russell Beale. "Narcissus: Visualizing Information" in Proceedings of the 1995 Information Visualization Symposium, Atlanta, GA, 90-96, 1995.
[HotSauce 1999] http://www.xspace.net/hotsauce, [5], 1999.
[Ingram 1996] Rob J. Ingram and Steven D. Benford. "The Application of Legibility Techniques to Enhance 3D Information Visualisations" in The Computer Journal, 39 (10), 819‚836, 1996.
[Lamping 1995] John Lamping, Ramona Rao, and Peter Pirolli. "A Focus+Context Technique Based on Hyperbolic Geometry for Visualizing Large Hierarchies" in Proceedings of ACM SIGCHI '95, Denver, CO, 401‚408, May 1995.
[Munzner 1995] Tamara Munzner and Paul Burchard. "Visualizing the Structure of the World Wide Web in 3D Hyperbolic Space" in Proceedings of VRML '95, San Diego, CA, 33-38, December 1995.
[Olsen 1993] Kai A. Olsen, Robert R. Korfhage, Kenneth M. Sochats, Michael B. Spring, James G. Williams. "Visualisation of a Document Collection: The VIBE System, Information Processing and Management, 29 (1), 69‚81, 1993.
[Shiozawa 1997] Hidekazu Shiozawa and Yutaka Matsushita. "WWW visualization giving meanings to interactive manipulations" in Advances in Human Factors/Ergonomics 21B (HCI International Ľ97), San Francisco, CA, 791-794, August 1997.
[SmartContent 1999] http://www.perspecta.com, [6], 1999.
[Snowdon 1997] David Snowdon, Steven D. Benford, Chris M. Greenhalgh, Rob Ingram, Chris C. Brown, Lennart FahlČn and MÂrten Stenius. "A 3D Collaborative Virtual Environment for Web Browsing" in Virtual Reality Universe '97, Santa Clara, California, USA, [11], April 1997.