In the fall of 2010, I had the opportunity to serve as graduate teaching assistant for Interdisciplinary Scientific Visualization in the department of computer science at Brown University. I gained knowledge of developing course syllabus, planning course schedules, picking inspiring reading materials, advise students on defining valuable research projects that are doable within a semester. The course website can be found here.
In this course, students learned how to do interdisciplinary scientific visualization research, from soup to nuts. Projects involved the solution of scientific problems using computer graphics, modeling, and visualization. Working in small groups, students identified scientific problems, propose solutions involving computational modeling and visualization, evaluate the proposals, design and implement the solutions, apply them to the problems, evaluate their success, and report on results. Examples include interactive software systems, immersive CAVE applications, quantitative analysis tools, or new applications of existing visualizations methods. The following are some snapshots from the class final-project abstracts/presentations.
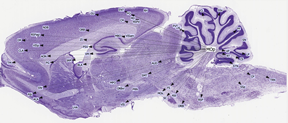
Steve: Interactive Maps for Functional Brain Connectivity Queries
Modeling Human Performance from Visualization Interaction Histories, IEEE InfoVis (Poster session), Honorable Mention, 2011, Steven R. Gomez and David H. Laidlaw
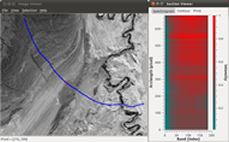
Ryan: Visualization of Hyperspectral Images Through Interactive Non-linear Sectionals
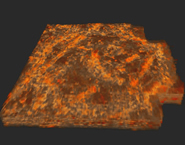
Andy and Tyler: Multimodal Volume Visualization of Geophysical Data for Archaeological Analysis
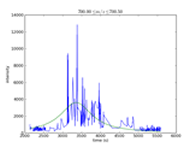
Justin and Sam: Statistical Assessment of Individual Peak Quantitation in Mass Spectrometric Data
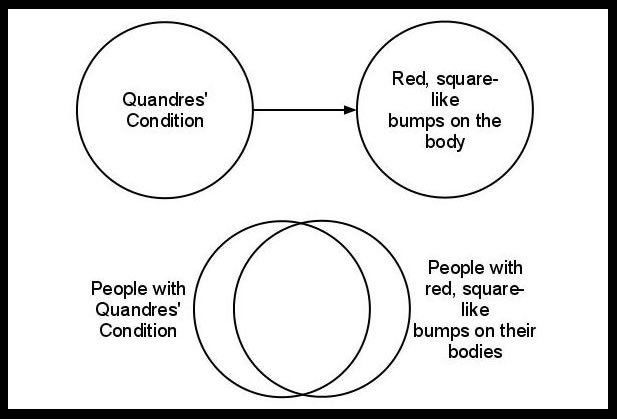
Gideon and Diem: Do explanations promote confidence in uncertainty visualizations? A user-study in medical diagnosis