Tour Guide
You may have experienced the great American tradition of the campus tour: the walking backwards, the explanation of meal plans, the intramural sports speech…. Don’t worry if you didn’t, you may not have missed out on much. Still, it’s considered a fine tradition…but the admissions department is running out of willing volunteers. That’s where you come in: you’ve been asked to write a program to calculate tours for campus visitors.
1 Theme Song
Lost Woods by Koji Kondo
2 Overview
The Admissions Office has given you map data that models Brown’s campus.Not actually true; the graph was created by former TAs. Here is a visualization of the campus map graph, created by 0190 alum Gareth Mansfield.
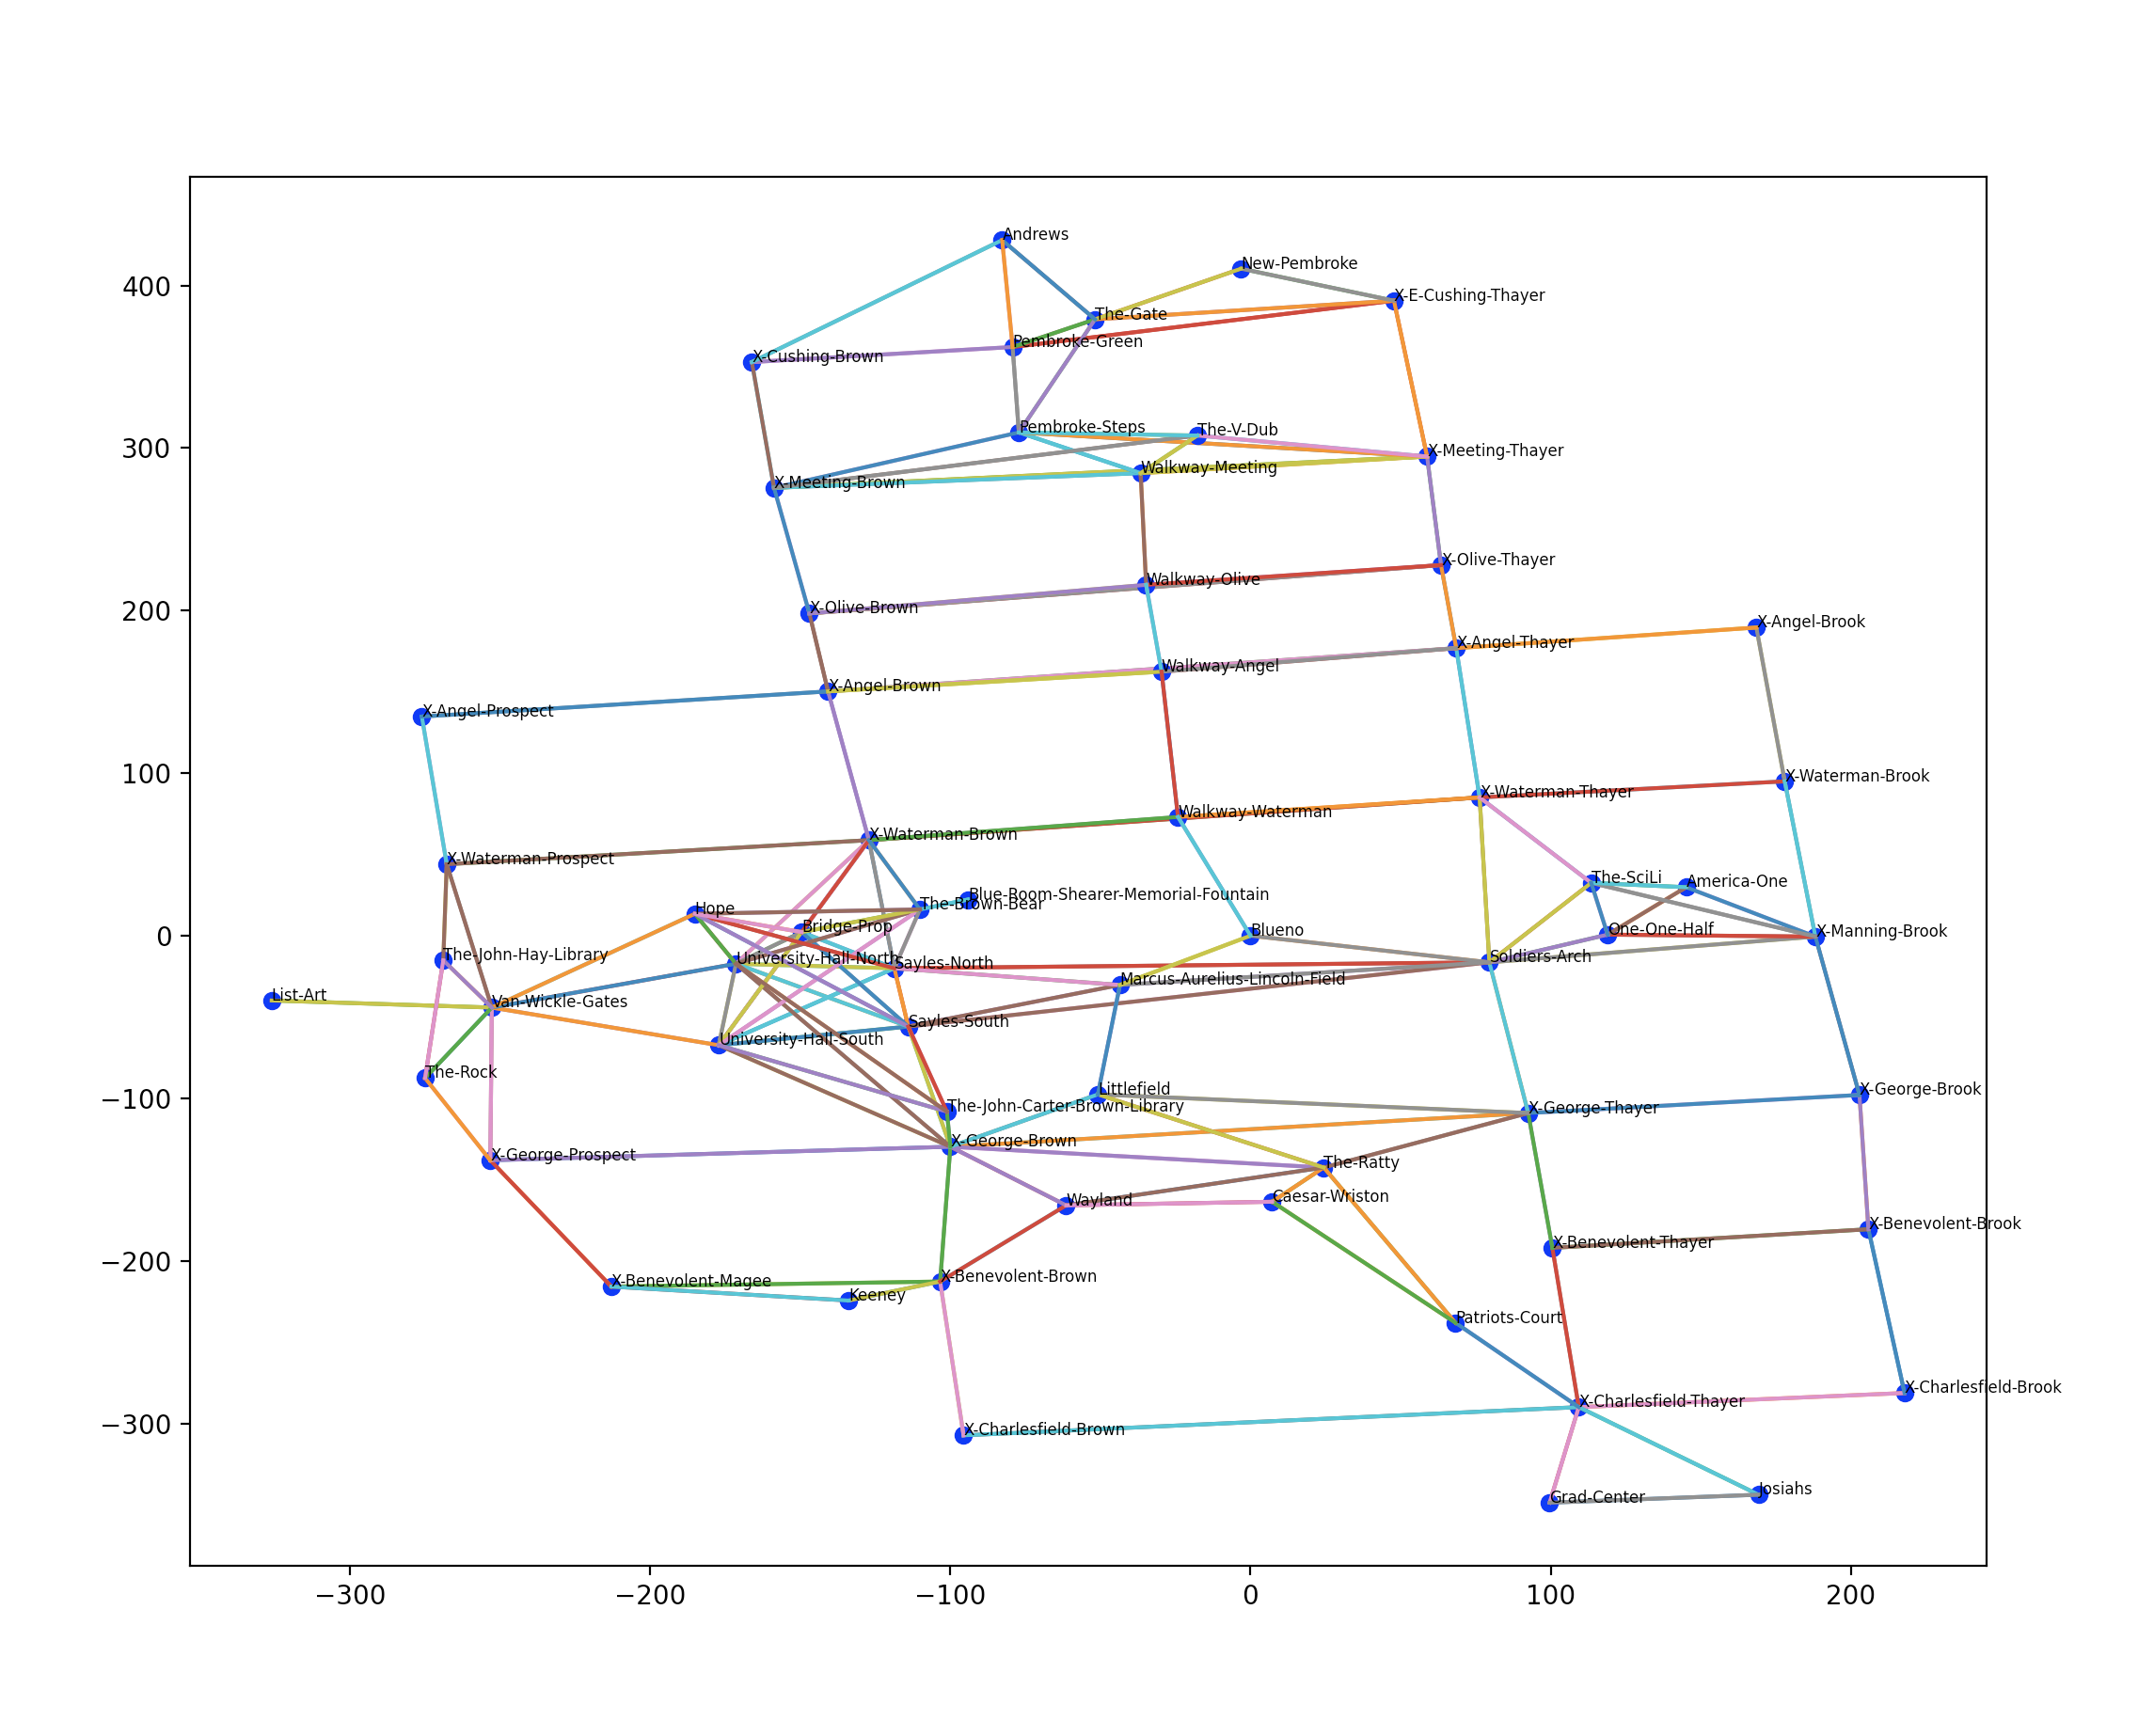
The map data contains many sites that are not tour stops, such as intersections and intermediate landmarks. All of the map locations, together with the paths between those locations, form a Graph. To go from one tour stop to another, your program should be able to find the shortest path from any point in this Graph to every other point in the Graph.
data Point:
| point(x :: Number, y :: Number)
end
data Place:
| place(
name :: Name,
position :: Point,
neighbors :: Set<Name>)
end
To provide a rough estimate of the time it takes tour guides to walk around buildings, the Admissions Office has a particular way they would like you to calculate the “distance” between two Places or Points. They define the “distance” between two Places or two Points as the Manhattan distance between their Cartesian coordinates: that is, the “distance” between two points \((a_x, a_y)\) and \((b_x, b_y)\) is the sum of the absolute differences of their Cartesian coordinates:
\[dist(a, b) = |a_x - b_x| + |a_y - b_y|\]
Place.distance :: Place -> Number This notation means that distance is a method on Places.
Given another Place, it returns the Manhattan distance between the two Places.
Point.distance :: Point -> Number
Given another Point, it returns the Manhattan distance between the two Points.
3 Dijkstra’s Algorithm
dijkstra :: Name, Graph -> Set<Path>
dijkstraYou are welcome to work with lists within your program and convert the output to a set at the end. You may assume that converting a list to a set using list-to-set runs in \(O([m \rightarrow m])\) time, where \(m\) is the number of elements in the list. This is not strictly the case, but you may assume this. consumes a Name denoting the starting Place for your shortest-path search, and the Graph of possible tour stop locations. It should return a Set<Path> (where a Path is a List<Name>) that contains a Path for every Place in the Graph indicating the shortest total distance path from the starting location to that Place.
The locations in each path should be in the reverse order of the order in which they should be visited to get from the starting location to the last location in the path (i.e., the starting location should be the last element, and the ending location should be the first element).
If the given name does not match any place in the graph, your program should reflect that there is no path to any places in the graph by returning the empty set.
Your dijkstra implementation should run in \(O([s \rightarrow s \cdot \log s])\) time, where \(s\) is the number of vertices in the graph. Note that a complete graph (with an edge between every pair of vertices) would have \((s \cdot (s−1))/2\) edges, making this impossible. However, graph representations of real maps are usually not so densely connected, and for your runtime analysis you may assume that each vertex has only some constant number of neighbors.
4 Campus Tour
Due to recent surges in the number of prospective students, the Admissions Office would also like to consolidate their existing tours into a single “campus tour”. More precisely, they would like you to extend your program to be able to find a path through sets of predefined “tours”, such as an “Art Tour” or “Dorm Tour”.
data Tour:
| tour(title :: String, stops :: Set<Name>)
end
Every Tour will have a unique, unambiguous title.
campus-tour :: Set<Tour>, Point, Graph -> Path
Observe that these Tours have no fixed order—
Even if the name of a place appears in multiple tours, it only needs to be visited once. At the same time, regardless of whether or not a name appears in any of the supplied tours, it is also possible to visit a place more than once if necessary.
Also, since a tour guide might not start their tour exactly at the same point as a place in the graph, your campus-tour function should first find the site closest to the starting Point, and then continue to the nearest tour stop according to the specifications above.
Keep in mind that if you aren’t given any tours or the tours you are given contain no places to visit, you don’t have to go anywhere, so make sure your output reflects this. (There are no runtime requirements for campus-tour, but you will be asked to analyze the runtime of this function [Analysis].)
5 Map Data
You should create your own map data to test your code. If you would like to try out actual map data from Brown’s campus, it can be found at this link. (Remember to import it.) You are welcome to play with the Brown data in the interactions window and use them in your tests. However, you should not rely solely on this data in your implementation because we might use different graphs when grading.
brown-university-landmarks :: Graph
Represents all of the locations on the Brown campus map that your program will be processing. This may be used as an argument to dijkstra or campus-tour.
brown-university-tours :: Set<Tour>
A set of tours provided by the Admissions Office. This may be used as an argument to campus-tour.
6 Support Code
to-graph :: Set<Place> -> Graph
Returns a graph containing the places in the given set. You can use this function for the purposes of creating graphs for testing your functions, but you are not allowed to use to-graph to implement any required functionality.
Graph.get :: Name -> PlaceRecall that this notation means this is a method.
Given a name, returns the place in the graph that has that name. You may assume this function runs in time constant in the number of places in the graph.
Graph.names :: -> Set<Name>
Returns a set containing the names of all places in the graph. You may assume this function runs in time linear in the number of places in the graph.
7 Testing
You may find writing tests for this assignment difficult at first. We strongly recommend drawing out example graphs by hand before writing tests to make sure that your understanding of the problem specification is correct (in particular, paying close attention to the Manhattan distance part of the specification).
Also, note that there may be multiple correct answers for dijkstra or campus-tour on certain graphs. You may wish to consider developing an is-valid function to verify that the properties of output from your functions are as expected.
8 Analysis
Analyze the worst-case running time of your dijkstra function. Show your work, as always!
Analyze the worst-case running time of your campus-tour function. Show your work, as always!
As is, your campus-tour always visits the nearest unvisited selected stop. Is this optimal? That is, does this algorithm create the shortest path visiting all the selected tour stops (in terms of Manhattan distance)? If so, explain why this is true. If not, provide a counter-example.
The distance function in this assignment is somewhat unconventional, but it is still compatible with Dijkstra’s algorithm. Consider the case where the Admissions Office requests a change to the Point.distance implementation so it uses a different distance function, such as Euclidean (straight-line) distance, spherical distance in latitude and longitude, etc. Does every possible distance function work with Dijkstra’s algorithm? If so, explain why this is true. If not, provide a counter-example. Assume that every function in the set of possible distance functions we are considering always returns a number given two points (that is, it does not raise an error).
9 Built-Ins
import string-dict as SD
type StringDict = SD.StringDict
The StringDict methods .get, .get-value, .set, .has-key, .remove, and .count run in constant time in the number of entries in the StringDict.
.keys runs in linear time in the number of entries in the StringDict.
10 Starter
11 Socially Responsible Computing
Credits: This assignment directly borrows from a related one by Prof. Malte Schwartzkopf.
You should consider starting this part of the assignment early, because it may take a while to obtain data. Don’t start it on the last day!
Read/View
Read this article.
Write
Before you proceed:
First: we want you to not make requests to any service you are uncomfortable with. That’s why we have the data from Brown: because you may not have any web service accounts and, even if you do, you may be uncomfortable requesting data from them. In particular, if requesting the data will put you at risk, do not do it! If you are uncomfortable getting data even from Brown, tell us why and we’ll see what we can work out.
Second: in your writeup, do not reveal to us anything meant to be private. In particular, do not give us your data! We can’t guarantee its security and don’t want to know private things about you.
Onward to what we want you to do:
In this assignment, you will investigate your personal data stored in different services. We will start with Brown! Go to https://my.brown.edu/ and login. Click on your “silhouette” (circle at top-right) and click on “Data & Privacy” under it. Please note that these data are meant for you only. Do not share these personal data with anyone else unless you fully understand the risks inherent in doing so.
(Note: if you see the message “There was an issue gathering your authorization event history. Please contact the Help Desk if the issue persists”, try again later: there are limits on how many requests can be made in a duration. If the issue persists for a day, post on EdStem.)
We suggest you consider making a similar data request for other web services you use. For some large services, you can find instructions online (e.g., Google, Facebook, Twitter, Instagram, Spotify), while others may require you to make a request (e.g., Pinterest, Netflix). For other services, a web search for “<service name> download data” often helps find instructions. There may also be other information sources: Twitter, for example, gives you the option to request a list of advertisers who have “uploaded” your contact details as part of an “audience” (go to “Settings | Account | Your Twitter Data | Interests and ads data | Tailored audiences”).
If a web service does not provide a way to access your data, or takes a while to do so, you could note that in your response: that’s also interesting!
Are the Brown data complete? In other words, are there any data you expect Brown to have collected on you that you do not see on the dashboard?
Do you think all the data Brown provides should be made available on your personal dashboard, or is there some information you think Brown should not share?
Is it clear what each field represents? Do you think any groups of people might have trouble understanding the data?
What were you surprised by/Was there data you did not expect to see? Why?
Are there dangers inherent in some of the data? Relate this to the Healy article.