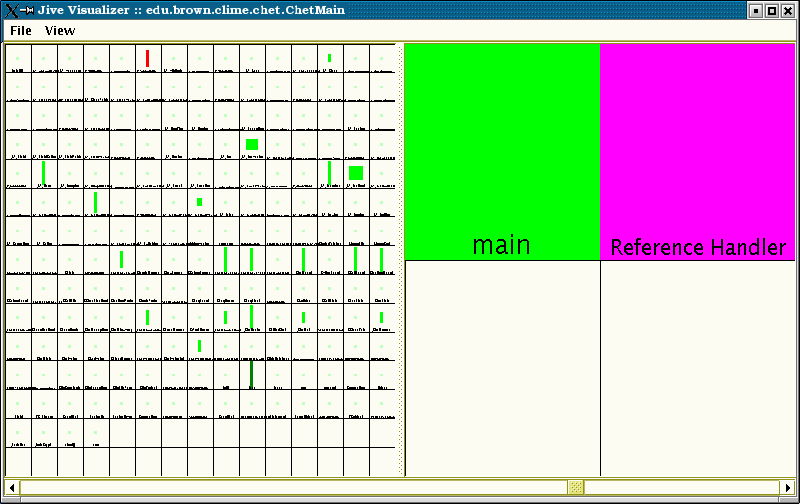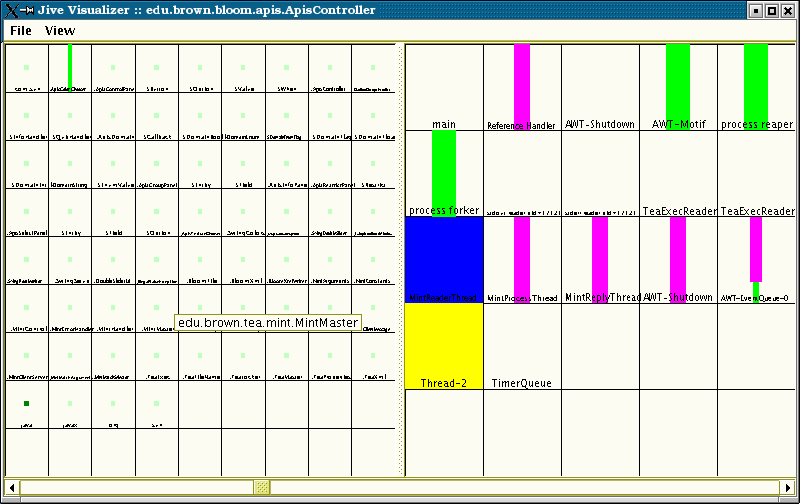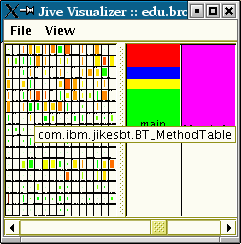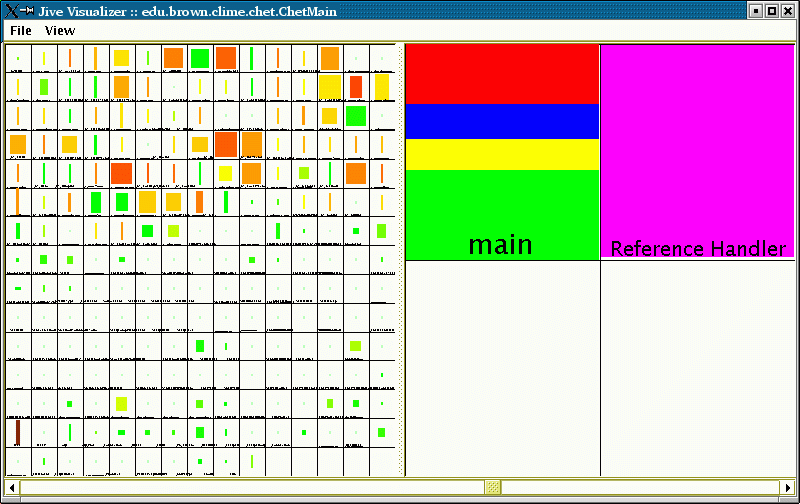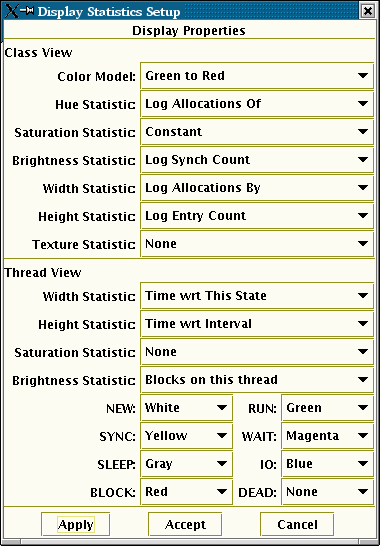
JIVE is a tool for visualizing a Java program in action. It does a minimal instrumentation of the user's Java program initially and then runs the instrumented program. The instrumentation slows the program down by a factor of 2 (or so, depending on the application dynamics). From the instrumentation, JIVE is able to provide a display showing what the program is doing as it is doing it. The display includes counts of the number of calls within each class (or package), number of allocations of each class, number of allocations by each class, number of synchronizations on each class. In addition, the display shows the state of each thread and the changes in state as well as synchronizations. States include IO, WAIT, SLEEP, BLOCKED, RUN, RUN SYNC, and DEAD. This display can either be a box display showing the fraction of time each thread spends in each state or a horizontal display showing the time history of threads. Synchronizations on a thread are shown in both views, one by darkening the display and the other with arrows connecting the synchronized threads.
Visualizing Java in Action, Proc. IEEE Conference on Software Visualization, pp. 123-132, May 2003.
JIVE: Visualizing Java in Action (Demonstration Description), ICSE 2003, May 2003.
JIVE VIDEO (Taken directly from the screen)