« Back to the main CS 131 website
Lab 3: Assembly and Buffer Overflow
Due February 25, 2020, at 8:00PM
Assignment
In this lab we will be working with x86-64 Assembly Code! 
The point of this lab is to get a basic understanding of how a computer navigates through a program’s execution at a fundamental level. That being said, we don’t expect you to remember how every detail of how assembly works.
Once a program is compiled into a binary, understanding what it does becomes a challenge. Since a great way to understand how something works is to understand how to break it, you’ll be hacking assembly programs.
Remind me what assembly code is?
Assembly code is a special type of programming language. Assembly code has a one to one mapping with machine code. That is, each assembly instruction specifies one specific action for the CPU to perform.
Assembly is not compiled; it is “assembled” into an executable. Each assembly instruction is translated directly into a machine instruction (binary).
Remind me what registers are?
Registers are memory cells on the CPU that are accessed and manipulated with machine instructions (which can be described in assembly language).
Special control registers define the CPU operating state. Other registers are used for passing arguments and storing variables temporarily.
Assignment Installation
First, ensure that your repository has a handout remote. Type:
$ git remote show handout
If this reports an error, run:
$ git remote add handout https://github.com/csci1310/cs131-s20-labs.git
Then run:
$ git pull
$ git pull handout master
This will merge our Lab 3 stencil code with your previous work. If you have any merge conflicts from Lab 2, resolve them before continuing further. Run git push to save your work back to your personal repository.
Part 1: Defusing Traps
Introduction
Navigate to the traps directory. In this part of the lab you’ll be working with two simple puzzle programs (the trap1 and trap2). Your task is figure out the correct input to give each one to defuse it. However, there’s a catch: you will only have access to the binary executables, not the source code.
To defuse these traps, you’ll make use of the objdump utility (a program used to display information about object files and executables like the assembly code), and GDB.
Note: You may also find it helpful to look through this x86 instruction reference.
We’ll work through the first trap together, and then you will solve the second trap yourself.
Context
Both the trap1 and trap2 executables call functions with the inputs you pass in. For example, trap1 will prompt you for one integer, and will call this function with that integer input:
int trap1(int input);
Depending on the value of the input, this function will return 0 or 1, where a return value of 1 will disarm the trap. If you run trap1 with the wrong input it will blow up the trap:
$ ./trap1
Enter code to disarm the trap:
1
💥💥💥💥 The trap blew up. Ouch. 💥💥💥💥
While you don’t have access to the source code of the traps, having any executable gives you access to instructions your OS will run (i.e. the assembly code). By reading through and stepping through the trap’s assembly code in GDB, you can figure out what input the function expects. Once you figure it out, you’ll see something like this:
$ ./trap1
Enter code to disarm the trap:
<input>
Trap 1 disarmed! Congratulations! 🎊
Trap 1
Let’s start by taking a look at the assembly contained in the trap1 exectuable, so we can start to pick apart what exactly it is doing.
Task: Dissasemble the trap1 binary into a .s file containing assembly using objdump.
$ objdump -d <executable name>
You can save the output of this command by redirecting it into a file:
$ objdump -d <executable name> > saved_output.txt
That’s a lot of text! We can fortunately ignore most of it, since the part we’re interested in is the trap1 function. trap1 can be found in the objdump under the <trap1> header (around line 224). It should look like this:
00000000000008f5 <trap1>:
8f5: 55 push %rbp
8f6: 48 89 e5 mov %rsp,%rbp
8f9: 89 7d ec mov %edi,-0x14(%rbp)
8fc: c7 45 fc 1e 05 00 00 movl $0x51e,-0x4(%rbp)
903: 8b 45 ec mov -0x14(%rbp),%eax
906: 3b 45 fc cmp -0x4(%rbp),%eax
909: 0f 9f c0 setg %al
90c: 0f b6 c0 movzbl %al,%eax
90f: 5d pop %rbp
910: c3 retq
911: 66 2e 0f 1f 84 00 00 nopw %cs:0x0(%rax,%rax,1)
918: 00 00 00
91b: 0f 1f 44 00 00 nopl 0x0(%rax,%rax,1)
By the x86 64-bit calling convention, the first six arguments are passed in the registers %rdi, %rsi, %rdx, %rcx, %r8, and %r9 (in that order).
Looking at the objdump, you can see that our integer input (which is located in the lower four bytes of%rdi) is moved into -0x14(%rbp):
8f9: 89 7d ec mov %edi,-0x14(%rbp)
Let’s use GDB to track this location throughout the trap1 function.
Task: Run trap1 in GDB. We are going to set a breakpoint at the trap1 function and use the GDB command layout asm.
layout asm: Remember layout src, which shows you the source code if an executable contains the source code’s debugging symbols? Our executables weren’t compiled with these debugging symbols, so we can’t use layout src, but we can uselayout asm to step through each assembly instruction:
(gdb) b trap1
(gdb) r
(gdb) layout asm
You should now see the assembly for the trap1 function in gdb. Your breakpoint should have stopped execution at this line:
| 0x5555555548f9 <trap1+4> mov %edi,-0x14(%rbp)
0x5555555548fc <trap1+7> movl $0x51e,-0x4(%rbp)
- The left-hand side is of the format:
instruction address <# of bytes from the starting instruction of trap1>
- The right-hand side is the
assembly instruction
Step 2: Use GDB to examine registers
By examining the contents of registers in gdb we can gain more information about the state of our program (the arguments, the return value, the size of local variables, etc.)
What are important registers to know for this lab?
The x86-64 architecture has 14 registers general purpose registers and many more special purpose registers. Here are a few important registers to keep in mind while doing this lab, but check out the assembly lecture for other x86-64 registers. It also might be useful to pull up the lecture notes as you’re doing this lab.
| Register |
Conventional Use |
Low 32-bits |
Low 16-bits |
Low 8-bits |
| %rax |
Return value |
%eax |
%ax |
%al |
| %rdi |
First Function Argument |
%edi |
%di |
%dil |
| %rsi |
Second Function Argument |
%esi |
%si |
%sil |
| %rdx |
Third Function Argument |
%edx |
%dx |
%dl |
| %rcx |
Fourth Function Argument |
%ecx |
%cx |
%cl |
| %rsp |
Stack pointer |
%esp |
%sp |
%spl |
| %rbp |
Base pointer |
%ebp |
%bp |
%bpl |
| %rip |
Instruction pointer |
%eip |
%ip |
|
Task: Verify that %edi does in fact contain your input. There are a few ways you can verify that %edi has your input as expected:
p $edi: this command should print the contents of the register %edi. Generally, p $<register> will do this.layout regs: This will pull up a persistent table of the registers and their contents above your assembly code. We recommend using this command throughout the lab.info r: This will print all of the registers and their contents.
Our input was placed into an offset from %rbp (specifically: -0x14(%rbp) ). By following this address in the code, we can get an idea of how the input is being used.
You can step through a single instruction in assembly with the si command.
(gdb) si
| 0x5555555548fc <trap1+7> movl $0x51e,-0x4(%rbp)
(gdb) si
| 0x555555554903 <trap1+14> mov -0x14(%rbp),%eax
(gdb) si
| 0x555555554906 <trap1+17> cmp -0x4(%rbp),%eax
Task: We know that our input was placed into %eax, but to understand what the cmp instruction is comparing, we need to know what was placed into -0x4(%rbp). Examine the contents of -0x4(%rbp).
Hint:
Since %rbp contains an address (specifically the base address of the current stack frame), %rbp - 0x4 also contains an address. To print the contents at an address in GDB, you can use the x command to examine what’s in an address. Since the cmp instruction is comparing the contents of -0x4(%rbp) to our integer input, it makes sense to examine the contents as a decimal integer.
For example:
(gdb) x $rbp-0x4
...
(gdb) x/d $rbp-0x4
...
The next instruction you encounter is:
(gdb) si
| 0x555555554909 <trap1+20> setg %al
Task: Step past the setg instruction, and then print out %al. If your input is less than or equal to the contents of -0x4(%rbp), you should notice that %al is 0. If your input was greater than -0x4(%rbp), then %al should be 1.
Step 3: Find the return value
Next, notice that %al is being moved into %eax.
(gdb) si
| 0x55555555490c <trap1+23> movzbl %al,%eax
Recall, that the %rax register serves as the return register, which means that the value in %rax at the time of the ret instruction will be the return value for the function. Since we want the trap1 function to return 1 in order to disarm the trap, any input greater than the contents of -0x4(%rbp) will successfully pass the trap.
Task:
- Now run the
trap1 executable outside of gdb with an argument that will disarm the trap. You should see: Trap 1 disarmed! Congratulations! 🎊 if you did it correctly.
- Additionally, write this argument into the file
trap1.txt, so that the grading server can check off your lab.
- If you want to ensure that your text file works, you can run:
./trap1 < trap1.txt, which will run trap1 and read the contents of trap1.txt into the program as input. You’ll see these redirection symbols (<) throughout the lab.
Trap 2:
Whoo! Congrats on getting through trap 1  . Now, you’re ready for trap 2! Like the
 trap1 executable, the trap2 executable calls a function using the inputs passed in. However, unlike trap1, trap2 expects two integer arguments separated by a space and will call this function with your inputs:
trap2(int arg1, int arg2)
To disarm the trap, you need to figure out two integer inputs that make the trap2 function return 1.
Task: Solve the second trap! Additionally, write the arguments that you used to solve the trap in the trap2.txt file on the same line, separated by a space. If you want to ensure that your text file works, you can run ./trap2 < trap2.txt.
Small Hint
Recall the techniques we used to solve step 1 (following the inputs, using gdb to examine registers, and finding the return value). A good first step is either to find the registers that contain your two inputs, or to find the contents that end up in the return register (%rax) and work backwards.
GDB Hint
You can break at a specific instruction using the following gdb command:
(gdb) b *(trap2+30)
Breakpoint 2 at 0x555555554983
(gdb) b *0x555555554983
Bigger Hint
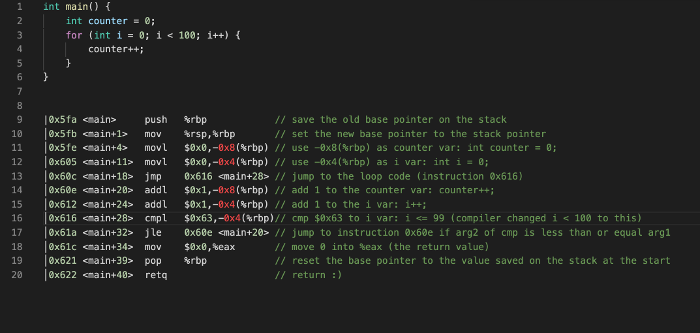
Notice that the assembly code for trap 2 contains instructions for a for loop. Here’s a simpler example of a for loop in assembly that might help you make sense of the code:
Part 2: Buffer Overflow
Introduction
The code for this part of the lab is in the buf sub-directory.
You’ve hopefully noticed by now that because C gives you as the programmer so much power to access memory, it’s very easy to modify data you weren’t directly intending to modify. What happens if you accidentally give a malicious user the unchecked power to modify your program’s data?
In this exercise you’ll get to the play the role of a malicious user, and hack a program we give you. 
What’s a buffer overflow attack? To avoid wasting memory in C, we often allocate memory for a well defined purpose if we want to work with it safely and meaningfully. A common mechanism to reconcile this fact with unpredicable program input/output (think user input) is to use a fixed buffer. A buffer is a reserved sequence of memory addresses for reading and writing data (you may remember that Lab 1 used a buffer before you changed it to use getline()). When the program writes more data to the buffer than the buffer has space for, it will overwrite data outside the buffer. This is called a buffer overflow.
Thus, even with well defined buffers you still need to be careful. Writing to memory willy-nilly is a surefire way to get undefined behavior… and gives clever hooligans a possible in to hack your programs 
gets()
There is a deprecated function in the stdio library called gets. This function is notoriously unsafe because it is vulnerable to buffer overflow attacks. Roughly speaking, a buffer overflow occurs when a program writes to memory beyond the buffer addresses and clobbers nearby data that was not supposed to be changed by the write.
The gets function was designed to be a convenient utility for reading a string from stdin. This is implemented by simply reading bytes (characters) into a buffer until the newline character (\n) is found.
Consider the following (somewhat uninteresting) C program:
#include <stdio.h>
int main(int argc, char **argv) {
char buffer[8];
gets(buffer);
return 0;
}
This program reads a string from stdin to an 8 byte stack allocated buffer. This seems fine at first glance, but consider how this program could break given how gets is implemented. What happens if the user inputs more than 7 characters before they press enter?
Note: gets will null-terminate the input string. If the user were to input 5 characters (e.g. hello) and then hit enter, it would place 6 characters [h, e, l, l, o, \0] into memory.
Overflow 1:
In this part of the lab, we are going to use a buffer overflow to change the value of a constant, stack-allocated variable.
The code we are attacking is in buffer.c. If we look at this file we will see a simple program that prints the programmers favorite number (twice) and makes a call to gets with a 32 byte buffer.
To get the full effect of this lab we encourage you to change the code so that fav_number is your actual favorite number. This will make the damaging possibilities of unsecure memory all the more real.
The compilation for buffer.c is a little bit more involved than standard C compilation because we need the stack to be stable and vulnerable. What this means is that we need to pass a bunch of flags to gcc to tell it to not put any modern safety features on the stack and to not treat it as position independent code.
We are providing a Makefile for you, so you don’t have to worry about these details. But check out the comments in the Makefile if you’re curious what options are being passed and why.
Task: Compile the buffer program with the command make buffer.
Once you have the program compiled use it once or twice to get a feel for what it does. You’ll notice that inputing 32 characters or less works fine and has a consistent and sane output:
$ ./buffer
My favorite number is 12 and it will always be 12 and nothing can change that
1234567
My favorite number is 12 and it will always be 12 and nothing can change that
Returned to main safe and sound
$
But what happens when we go over 32 characters?
Sample Walkthrough: To understand how a buffer overflow occurs, it is very useful to visualize what is happening on the stack. We put together these slides walking through a sample execution of buffer.
Task: Give input to ./buffer such that you cause a buffer overflow to (tragically) change fav_number to anything but 12 at runtime. The program should not segfault.
Hint:
We know that the buffer is only 32 bytes so writing more than 32 characters will overflow into other stack memory. But how do we know how much to write to get to the stack memory associated with the variable fav_number?
One way to do this is to use gdb to print out the address of buffer and fav_number and see how many bytes away they are.
Don’t pay attention to the exact numbers below, as the addresses could be different for you depending on how your program is compiled and linked.
(gdb) b getCLI_and_tell_me_your_favorite_number
Breakpoint 1 at 0x739: file buffer.c, line 12.
(gdb) r
...
(gdb) p &buf
$1 = (char (*)[32]) 0x7fffffffe330
(gdb) p &fav_number
$2 = (const int *) 0x7fffffffe35c
We see here that the stack address of fav_number is 0x2c=44 bytes ahead of the buffer so we need to write 44 characters to start affecting fav_number
In order to not segfault, don’t write over more of the stack than you need! Remember that some of the values on the stack are used to manage stack frames and the processor will freak out if this gets messed up.
You don’t need to set fav_number to a specific number for this task; anything that changes its value is fine.
For that task it was easy to type input directly into ./buffer, but if we want more control over what we write this approach is incredibly inconvenient. Because we are providing a string, the program is encoding the characters we input into ASCII character codes for each byte. This means that in order to write specific numeric byte values to memory, we would have to map our characters to bytes with an ASCII table.
To make life easier, we provide a program exploit.c that generates a particular binary output string and writes it to stdout. This string can contain non-printable characters! It’s default behavior is to print 32 bytes of all zeroes.
You can compile the helper program with make exploit. You can compile and run exploit with its output sent directly into the stdin of buffer with the command make do_hack.
Your computer (and thus, your course VM) uses a 64 bit architecture with little-endian data representation. That means that if we have a 4-byte integer in memory, it will be stored with the least significant bytes first:
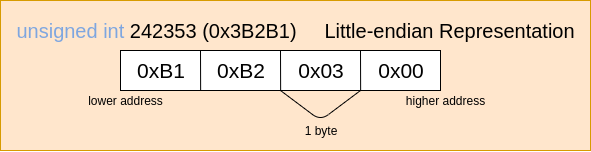
Keep this in mind when writing to memory!
Task: Use the exploit program to cause a buffer overflow that changes fav_number to 131 at runtime. The program should not segfault.
Hint:
As soon as the newline character appears gets will stop reading data and add the null terminating character to the buffer. The byte that represents newline in ASCII is 0x0a.
The decimal number 131 is 0x83 in hexcadecimal.
It might also be helpful to look at the bytes you are writing in GDB. The gdb examine utility might come in handy. The syntax for this command is x/(number)(format)(unit size). So, if we wanted to print out the 32 bytes of memory at the address of buf as hexadecimal bytes the command would be:
x/32xb &buf
A good way to tackle this problem if you get stuck is to use GDB to step through foo() and examine the buffer memory addresses. Look for the number 12 (0x0c)! You can format your exploit according to the memory dump.
To pipe your exploit to GDB you simply run gdb buffer and then run within gdb with r < exploit.txt (be sure you’ve written the exploit with the most up to date sequence of bytes!). You can create an exploit1.txt file with the contents of your exploit with the command make exploit_text1, which dumps the output of ./exploit into a the text file.
Once you have your exploit working, run make exploit_text1. This will write the current contents of your exploit buffer into a file exploit1.txt. If you want to verify that this worked correctly, you make run ./buffer < exploit1.txt. This should give the same output as make do_hack.
It is important that you do this: we will use your exploit1.txt file for the checkoff!
The x86-64 Stack
In order to understand why the next part of this lab works the way it does, it is important to understand the x86 call stack. A call stack memory organization that enables function calls and local variable access with automatic lifetime.
If you feel comfortable with this from lectures, feel free to directly move on to the buffer overflow. If you’re not sure, you may want to go through some or all of the walkthrough below!
Keep in mind that the stack grows downward in memory! The “top” of the stack is the lowest memory address in the stack.
Walk through the x86-64 Call Stack.
We are going to track an x86 call stack through a sequence of function calls. Consider the following code snippet (found in example.c) as an example:
#include <stdio.h>
void bar(int a) {
int b = 8;
printf("%d\n",a + b);
}
void foo(int a) {
bar(a);
}
int main() {
int a = 8;
foo(a);
}
The compiled assembly for these functions is given below (courtesy of objdump):
Assembly code
000000000000064a <bar>:
64a: 55 push
64b: 48 89 e5 mov
64e: 48 83 ec 20 sub $0x20,
652: 89 7d ec mov
655: c7 45 fc 08 00 00 00 movl $0x8,-0x4(
65c: 8b 55 ec mov -0x14(
65f: 8b 45 fc mov -0x4(
662: 01 d0 add
664: 89 c6 mov
666: 48 8d 3d d7 00 00 00 lea 0xd7(
66d: b8 00 00 00 00 mov $0x0,
672: e8 a9 fe ff ff callq 520 <printf@plt>
677: 90 nop
678: c9 leaveq
679: c3 retq
000000000000067a <foo>:
67a: 55 push
67b: 48 89 e5 mov
67e: 48 83 ec 10 sub $0x10,
682: 89 7d fc mov
685: 8b 45 fc mov -0x4(
688: 89 c7 mov
68a: e8 bb ff ff ff callq 64a <bar>
68f: 90 nop
690: c9 leaveq
691: c3 retq
0000000000000692 <main>:
692: 55 push
693: 48 89 e5 mov
696: 48 83 ec 10 sub $0x10,
69a: c7 45 fc 08 00 00 00 movl $0x8,-0x4(
6a1: 8b 45 fc mov -0x4(
6a4: 89 c7 mov
6a6: e8 cf ff ff ff callq 67a <foo>
6ab: b8 00 00 00 00 mov $0x0,
6b0: c9 leaveq
6b1: c3 retq
6b2: 66 2e 0f 1f 84 00 00 nopw
6b9: 00 00 00
6bc: 0f 1f 40 00 nopl 0x0(
How we got this assembly
gcc -O0 example.c -o example && objdump -d example
Don’t worry if you don’t understand everything that is going on in the assembly code! Notice though that certain registers are frequently used in similar ways, especially at the start and end of function code.
At any given point, the execution of a computer program can be entirely described by the values within 3 registers
%rbp : 64-bit address in the stack segment that is the base of the current stack frame (a.k.a. base pointer).%rsp : 64-bit address in the stack segment that is the top of the current stack frame (a.k.a. stack pointer)%rip : 64-bit address in the text segment that is the address of the next instruction to be executed (a.k.a. instruction pointer).
Between the values in %rbp and %rsp we know the location of the current stack frame (and therefore the local variables and arguments available to us) and with the value in %rip we know what instruction we’re executing.
Note: When an x86 CPU performs a push instruction the value in %rsp is automatically decremented by the size of the data pushed. The pop instruction automatically increments the value in %rsp. In effect, these two instructions grow and shrink the current stack frame.
Everytime the computer executes a normal instruction %rip gets automatically incremented to the next instruction. Certain special instructions can “jump” or put an address into the instruction pointer that is not the next sequential address. This is how functions and branch logic (e.g. if and for statements) work at the register level.
The x86 calling convention uses two special jumping instructions:
call <addr>. The assembly instruction for calling a function. It stores addr into %rip to begin executing that part of the text section. This function also pushes the current instruction pointer (%rip) onto the stackret The assembly instruction for returning from a function. This instruction pops the top of the stack into %rip.
Note: The “q” suffix in x86 assembly means “quad”. All this does is specify that the operation is performed on a 64 bit operand. For instance callq means call a function with a 64 bit address.
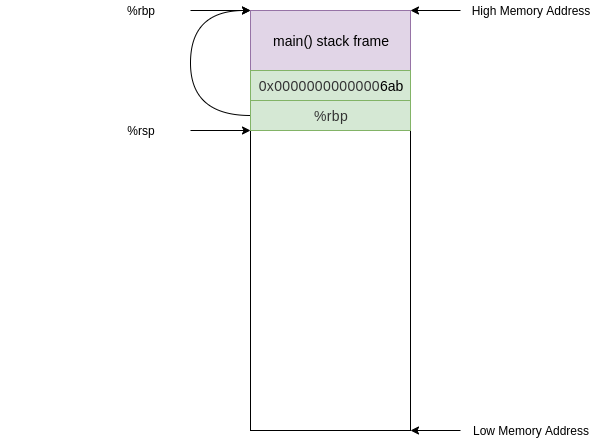
Looking at the instruction at address 0x00000000000006a6 we see a call to foo. (some investigation of the assembly code will reveal that 0x000000000000067a is the address of foo in text)
6a6: e8 cf ff ff ff callq 67a <foo>
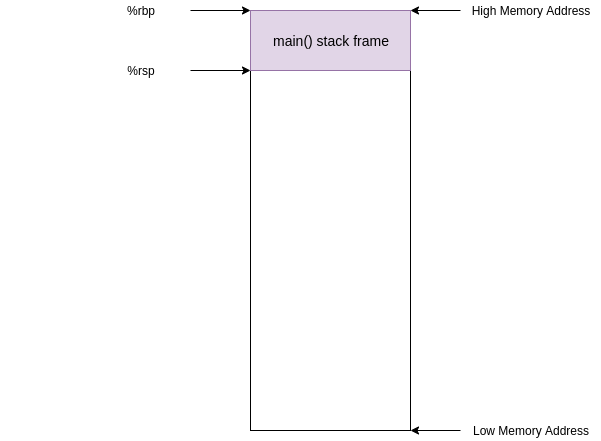
Before this instruction, %rip contained the address of the next instruction (0x00000000000006ab) and the stack looked something like this
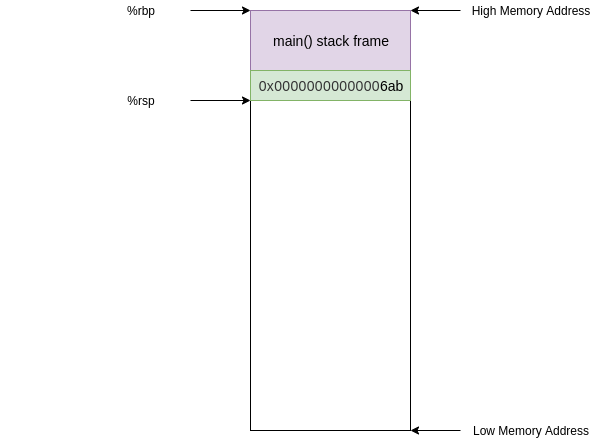
After this instruction %rip contains the address of foo (0x000000000000067a) and the old value in %rip was pushed onto the stack
The next instruction we execute will be at the address of foo in the text segment.
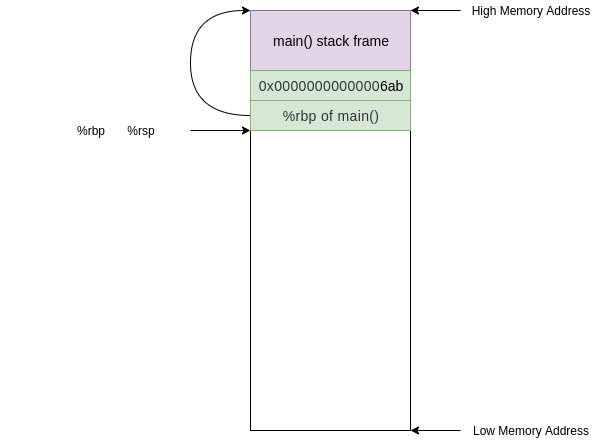
67a: 55 push %rbp
This instruction simply pushes the current %rbp value onto the stack. Now the value at the top of our stack is an address that points to the current base of our stack (along with %rbp)
push is not a jumping instruction so the next instruction we execute will be the next sequential instruction at address 0x000000000000067b
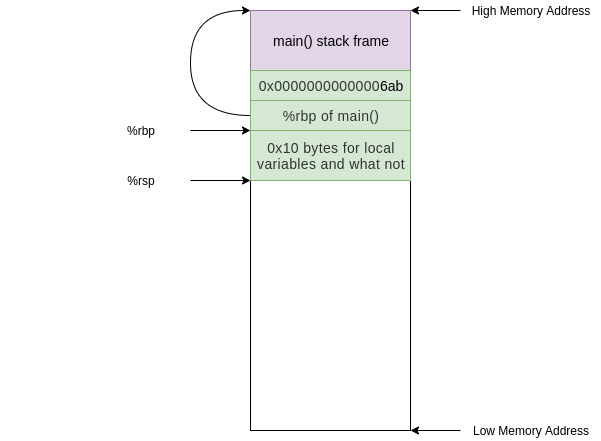
67b: 48 89 e5 mov %rsp,%rbp
This instruction updates the base pointer by moving the current stack pointer value into the base pointer. Now the value on the top of the stack is the “old” base pointer from main and the current base pointer points to the top of the stack.
We are almost done setting up the stack frame for foo(). All we need is some allocated space to deal with local variables. Our next instruction does exactly this
67e: 48 83 ec 10 sub $0x10,%rsp
This has moved the top of our stack 0x10 (or 16 in decimal) bytes down and therefore allocated 0x10 bytes.
The reason we need 0x10 of space is because of alignment. We only need 0x4 bytes to store the int argument on the stack but because of some x86_64 shenanigans the stack pointer must be 16 byte aligned. (“ABI” stands for application binary interface for those who clicked the link)
After this instruction our stack looks like this
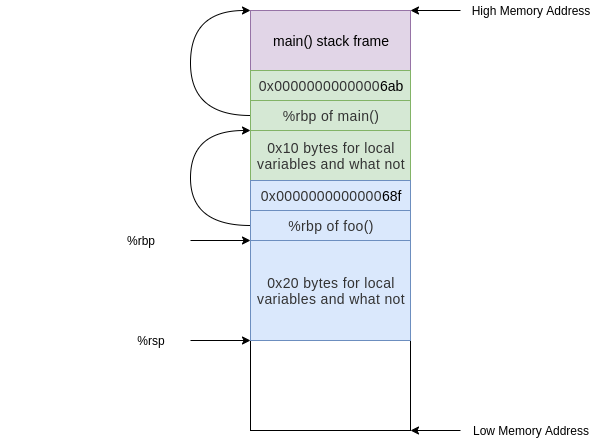
At this point in the execution we have the stack frame established and we perform a task. The only task that foo() does is call bar(), we see this in the instruction at address 0x000000000000068a
68a: e8 bb ff ff ff a callq 64a <bar>
At this point the stack would undergo the same process as above but instead starting from the foo() stack frame and allocating 0x20 bytes instead of 0x10:
Now we’ve built the stack for the functions in our program… but how about cleanup?
Before the function bar() returns it uses the leaveq instruction.
678: c9 leaveq
679: c3 retq
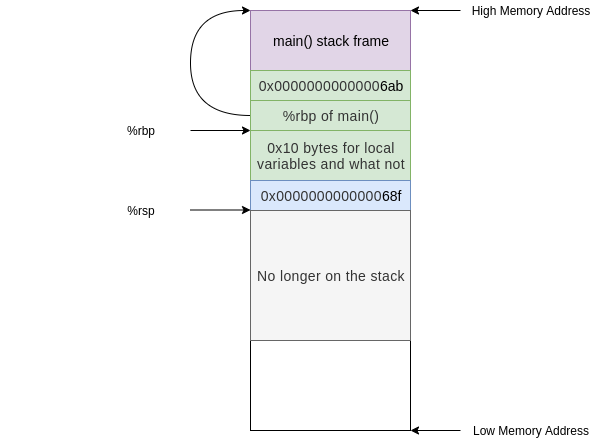
leaveq is a convienient instruction that optimizes/condenses the collapse of a stack frame. The effect of the leaveq instruction is exactly equivalent to the following sequence of instructions.
mov %rbp,%rsp
pop %rbp
This first moves the current base pointer value into the stack pointer. Effectively resetting any of the space subtracted for local variables when we set up the stack frame.
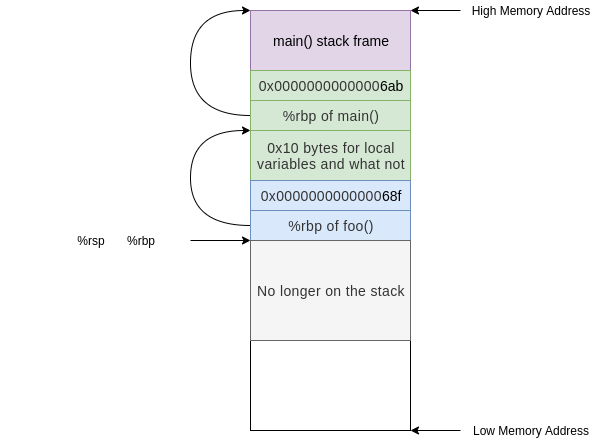
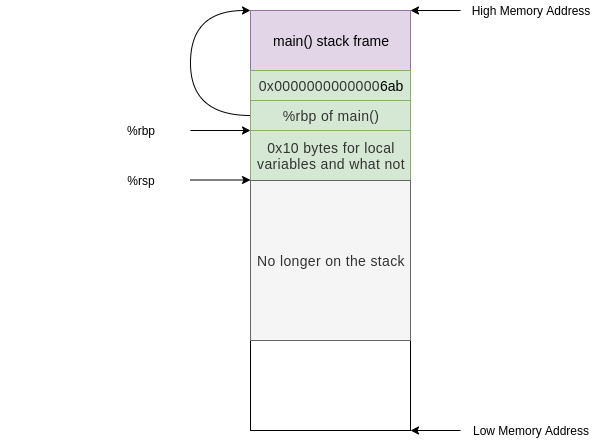
Next we pops the value at the top of the stack into %rbp, restoring the base pointer to the base pointer of foo()
After the leaveq instruction we are ready to go home and call retq. This pops the address of the next instruction in foo() after the call to bar() into %rip. Now we are executing instructions in foo() and the stack frame we have is exactly that of foo()
This is the call stack mechanism by which functions call and return. Hopefully it is clear how scope is created and removed from the stack and how it is possible to move into a previous stack frame.
Overflow 2:
Note that you must develop your exploit for this part of the lab inside your course VM. If you build the buffer executable outside the course VM, differing compiler and linker versions may put the hack() function at a different address in memory than they would in the VM and on the grading server, and your exploit2.txt file will no longer work on the grading server.
Now let’s hack the call stack of our buffer program. We have written an unused function hack() in the buffer.c file, and your job is to somehow execute this function at runtime without putting an invocation in the program code.
You can check if your solution works by running make do_hack and checking if the hacking text is printed.
Task: Use the exploit program to cause a buffer overflow that results in the execution of the hack() function. Again, this should not cause the program to segfault.
Hint:
Consider targeting the retq instruction to load a particular address into %rip. From where does retq take a value? If you don’t know the answer to this question, read the walk through of the x86-64 call stack.
Once you have your exploit working, run make exploit_text2. This will write the current contents of your exploit buffer into a file exploit2.txt. If you want to verify that this worked correctly, you make run ./buffer < exploit2.txt. This should give the same output as make do_hack.
It is important that you do this: we will use your exploit2.txt file to check off the lab.
Handin instructions
Turn in your code by pushing your git repository to github.com/csci1310/cs131-s20-labs-YOURNAME.git.
Then, head to the grading server. On the “Labs” page, use the “Lab 3 checkoff” button to check off your lab.
« Back to the main CS 131 website
Lab 3: Assembly and Buffer Overflow
Due February 25, 2020, at 8:00PM
Assignment
In this lab we will be working with x86-64 Assembly Code!
The point of this lab is to get a basic understanding of how a computer navigates through a program’s execution at a fundamental level. That being said, we don’t expect you to remember how every detail of how assembly works.
Once a program is compiled into a binary, understanding what it does becomes a challenge. Since a great way to understand how something works is to understand how to break it, you’ll be hacking assembly programs.
Remind me what assembly code is?
Assembly code is a special type of programming language. Assembly code has a one to one mapping with machine code. That is, each assembly instruction specifies one specific action for the CPU to perform.
Assembly is not compiled; it is “assembled” into an executable. Each assembly instruction is translated directly into a machine instruction (binary).
Remind me what registers are?
Registers are memory cells on the CPU that are accessed and manipulated with machine instructions (which can be described in assembly language).
Special control registers define the CPU operating state. Other registers are used for passing arguments and storing variables temporarily.
Assignment Installation
First, ensure that your repository has a
handoutremote. Type:If this reports an error, run:
Then run:
This will merge our Lab 3 stencil code with your previous work. If you have any merge conflicts from Lab 2, resolve them before continuing further. Run
git pushto save your work back to your personal repository.Part 1: Defusing Traps
Introduction
Navigate to the
trapsdirectory. In this part of the lab you’ll be working with two simple puzzle programs (thetrap1andtrap2). Your task is figure out the correct input to give each one to defuse it. However, there’s a catch: you will only have access to the binary executables, not the source code.To defuse these traps, you’ll make use of the
objdumputility (a program used to display information about object files and executables like the assembly code), and GDB.Note: You may also find it helpful to look through this x86 instruction reference.
We’ll work through the first trap together, and then you will solve the second trap yourself.
Context
Both the
trap1andtrap2executables call functions with the inputs you pass in. For example,trap1will prompt you for one integer, and will call this function with that integer input:Depending on the value of the input, this function will return
0or1, where a return value of1will disarm the trap. If you runtrap1with the wrong input it will blow up the trap:$ ./trap1 Enter code to disarm the trap: 1 # type this as your input 💥💥💥💥 The trap blew up. Ouch. 💥💥💥💥While you don’t have access to the source code of the traps, having any executable gives you access to instructions your OS will run (i.e. the assembly code). By reading through and stepping through the trap’s assembly code in GDB, you can figure out what input the function expects. Once you figure it out, you’ll see something like this:
$ ./trap1
Enter code to disarm the trap:
<input> # in the next step, we'll walk through how to find this input
Trap 1 disarmed! Congratulations! 🎊
Trap 1
Let’s start by taking a look at the assembly contained in the
trap1exectuable, so we can start to pick apart what exactly it is doing.Task: Dissasemble the
trap1binary into a.sfile containing assembly usingobjdump.$ objdump -d <executable name>You can save the output of this command by redirecting it into a file:
$ objdump -d <executable name> > saved_output.txtThat’s a lot of text! We can fortunately ignore most of it, since the part we’re interested in is the
trap1function.trap1can be found in the objdump under the<trap1>header (around line 224). It should look like this:Step 1: Find our input
By the x86 64-bit calling convention, the first six arguments are passed in the registers
%rdi,%rsi,%rdx,%rcx,%r8, and%r9(in that order).Looking at the
objdump, you can see that our integer input (which is located in the lower four bytes of%rdi) is moved into-0x14(%rbp):Let’s use GDB to track this location throughout the
trap1function.Task: Run
trap1in GDB. We are going to set a breakpoint at thetrap1function and use the GDB commandlayout asm.layout asm: Rememberlayout src, which shows you the source code if an executable contains the source code’s debugging symbols? Our executables weren’t compiled with these debugging symbols, so we can’t uselayout src, but we can uselayout asmto step through each assembly instruction:(gdb) b trap1 (gdb) r # at this point you will be asked to enter a code to defuse the trap. # you can enter any arbitrary integer for now # once you enter a value, you will hit your breakpoint (gdb) layout asmYou should now see the assembly for the
trap1function in gdb. Your breakpoint should have stopped execution at this line:instruction address <# of bytes from the starting instruction of trap1>assembly instructionStep 2: Use GDB to examine registers
By examining the contents of registers in
gdbwe can gain more information about the state of our program (the arguments, the return value, the size of local variables, etc.)What are important registers to know for this lab?
The x86-64 architecture has 14 registers general purpose registers and many more special purpose registers. Here are a few important registers to keep in mind while doing this lab, but check out the assembly lecture for other x86-64 registers. It also might be useful to pull up the lecture notes as you’re doing this lab.
Task: Verify that
%edidoes in fact contain your input. There are a few ways you can verify that%edihas your input as expected:p $edi: this command should print the contents of the register%edi. Generally,p $<register>will do this.layout regs: This will pull up a persistent table of the registers and their contents above your assembly code. We recommend using this command throughout the lab.info r: This will print all of the registers and their contents.Step 3: Follow your Input
Our input was placed into an offset from
%rbp(specifically:-0x14(%rbp)). By following this address in the code, we can get an idea of how the input is being used.You can step through a single instruction in assembly with the
sicommand.(gdb) si # some constant value is being moved into 0x4($rbp) | 0x5555555548fc <trap1+7> movl $0x51e,-0x4(%rbp) (gdb) si # our input is being moved from the $rbp offset into $eax | 0x555555554903 <trap1+14> mov -0x14(%rbp),%eax (gdb) si # our input in $eax is being compared to the contents of -0x4(%rbp) | 0x555555554906 <trap1+17> cmp -0x4(%rbp),%eax # The cmp operation subtracts the first argument from the second and # sets a flag accordingly to indicate if the second argument is greater than, # less than, or equal to the first. # The instruction immediately afterwards will perform an operation # based on the comparison flags. Stay tuned for the next instruction.Task: We know that our input was placed into
%eax, but to understand what thecmpinstruction is comparing, we need to know what was placed into-0x4(%rbp). Examine the contents of-0x4(%rbp).Hint:
Since
%rbpcontains an address (specifically the base address of the current stack frame),%rbp-0x4also contains an address. To print the contents at an address in GDB, you can use thexcommand to examine what’s in an address. Since thecmpinstruction is comparing the contents of-0x4(%rbp)to our integer input, it makes sense to examine the contents as a decimal integer.For example:
# examines the contents at `-0x4(%rbp)`
(gdb) x $rbp-0x4
...
# examines the contents at `-0x4(%rbp)` as a decimal
(gdb) x/d $rbp-0x4
...
The next instruction you encounter is:
(gdb) si
# sets the register %al if the
# previous comparison indicated that the second argument (%eax)
# was greater than the first (-0x4(%rbp)).
| 0x555555554909 <trap1+20>               setg   %al
Task: Step past the
setginstruction, and then print out%al. If your input is less than or equal to the contents of-0x4(%rbp), you should notice that%alis 0. If your input was greater than-0x4(%rbp), then%alshould be 1.Step 3: Find the return value
Next, notice that
%alis being moved into%eax.(gdb) si # moves the lower byte from %al to %eax and zeroes out the # higher bytes up until a long (4 bytes) | 0x55555555490c <trap1+23> movzbl %al,%eaxRecall, that the
%raxregister serves as the return register, which means that the value in%raxat the time of theretinstruction will be the return value for the function. Since we want thetrap1function to return1in order to disarm the trap, any input greater than the contents of-0x4(%rbp)will successfully pass the trap.Task:
trap1executable outside of gdb with an argument that will disarm the trap. You should see:Trap 1 disarmed! Congratulations! 🎊if you did it correctly.trap1.txt, so that the grading server can check off your lab../trap1 < trap1.txt, which will runtrap1and read the contents oftrap1.txtinto the program as input. You’ll see these redirection symbols (<) throughout the lab.Trap 2:
Whoo! Congrats on getting through trap 1 . Now, you’re ready for trap 2! Like the
trap1executable, thetrap2executable calls a function using the inputs passed in. However, unliketrap1,trap2expects two integer arguments separated by a space and will call this function with your inputs:To disarm the trap, you need to figure out two integer inputs that make the
trap2function return 1.Task: Solve the second trap! Additionally, write the arguments that you used to solve the trap in the
trap2.txtfile on the same line, separated by a space. If you want to ensure that your text file works, you can run./trap2 < trap2.txt.Small Hint
Recall the techniques we used to solve step 1 (following the inputs, using gdb to examine registers, and finding the return value). A good first step is either to find the registers that contain your two inputs, or to find the contents that end up in the return register (
%rax) and work backwards.GDB Hint
You can break at a specific instruction using the following gdb command:
// breaks at the instruction contained at the address
// 30 bytes from the start of the trap2 function
(gdb) b *(trap2+30)
Breakpoint 2 at 0x555555554983

// breaks when the instruction pointer points at a specific address
(gdb) b *0x555555554983
Bigger Hint
Notice that the assembly code for trap 2 contains instructions for a

forloop. Here’s a simpler example of aforloop in assembly that might help you make sense of the code:Part 2: Buffer Overflow
Introduction
The code for this part of the lab is in the
bufsub-directory.You’ve hopefully noticed by now that because C gives you as the programmer so much power to access memory, it’s very easy to modify data you weren’t directly intending to modify. What happens if you accidentally give a malicious user the unchecked power to modify your program’s data?
In this exercise you’ll get to the play the role of a malicious user, and hack a program we give you.
What’s a buffer overflow attack? To avoid wasting memory in C, we often allocate memory for a well defined purpose if we want to work with it safely and meaningfully. A common mechanism to reconcile this fact with unpredicable program input/output (think user input) is to use a fixed buffer. A buffer is a reserved sequence of memory addresses for reading and writing data (you may remember that Lab 1 used a buffer before you changed it to use
getline()). When the program writes more data to the buffer than the buffer has space for, it will overwrite data outside the buffer. This is called a buffer overflow.Thus, even with well defined buffers you still need to be careful. Writing to memory willy-nilly is a surefire way to get undefined behavior… and gives clever hooligans a possible in to hack your programs
gets()There is a deprecated function in the stdio library called
gets. This function is notoriously unsafe because it is vulnerable to buffer overflow attacks. Roughly speaking, a buffer overflow occurs when a program writes to memory beyond the buffer addresses and clobbers nearby data that was not supposed to be changed by the write.The
getsfunction was designed to be a convenient utility for reading a string fromstdin. This is implemented by simply reading bytes (characters) into a buffer until the newline character (\n) is found.Consider the following (somewhat uninteresting) C program:
#include <stdio.h>

int main(int argc, char **argv) {
    char buffer[8];
    gets(buffer);
    return 0;
}
This program reads a string from
stdinto an 8 byte stack allocated buffer. This seems fine at first glance, but consider how this program could break given howgetsis implemented. What happens if the user inputs more than 7 characters before they press enter?Note:
getswill null-terminate the input string. If the user were to input 5 characters (e.g.hello) and then hit enter, it would place 6 characters[h, e, l, l, o, \0]into memory.Overflow 1:
In this part of the lab, we are going to use a buffer overflow to change the value of a constant, stack-allocated variable.
The code we are attacking is in
buffer.c. If we look at this file we will see a simple program that prints the programmers favorite number (twice) and makes a call togetswith a 32 byte buffer.To get the full effect of this lab we encourage you to change the code so that
fav_numberis your actual favorite number. This will make the damaging possibilities of unsecure memory all the more real.The compilation for
buffer.cis a little bit more involved than standard C compilation because we need the stack to be stable and vulnerable. What this means is that we need to pass a bunch of flags to gcc to tell it to not put any modern safety features on the stack and to not treat it as position independent code.We are providing a Makefile for you, so you don’t have to worry about these details. But check out the comments in the Makefile if you’re curious what options are being passed and why.
Task: Compile the
bufferprogram with the commandmake buffer.Once you have the program compiled use it once or twice to get a feel for what it does. You’ll notice that inputing 32 characters or less works fine and has a consistent and sane output:
$ ./buffer
My favorite number is 12 and it will always be 12 and nothing can change that
1234567 # user input
My favorite number is 12 and it will always be 12 and nothing can change that
Returned to main safe and sound
$
But what happens when we go over 32 characters?
Sample Walkthrough: To understand how a buffer overflow occurs, it is very useful to visualize what is happening on the stack. We put together these slides walking through a sample execution of
buffer.Task: Give input to
./buffersuch that you cause a buffer overflow to (tragically) changefav_numberto anything but 12 at runtime. The program should not segfault.Hint:
We know that the buffer is only 32 bytes so writing more than 32 characters will overflow into other stack memory. But how do we know how much to write to get to the stack memory associated with the variable
fav_number?One way to do this is to use gdb to print out the address of
bufferandfav_numberand see how many bytes away they are.Don’t pay attention to the exact numbers below, as the addresses could be different for you depending on how your program is compiled and linked.
(gdb) b getCLI_and_tell_me_your_favorite_number
Breakpoint 1 at 0x739: file buffer.c, line 12.
(gdb) r
...
(gdb) p &buf
$1 = (char (*)[32]) 0x7fffffffe330
(gdb) p &fav_number
$2 = (const int *) 0x7fffffffe35c
We see here that the stack address of
fav_numberis 0x2c=44 bytes ahead of the buffer so we need to write 44 characters to start affectingfav_numberIn order to not segfault, don’t write over more of the stack than you need! Remember that some of the values on the stack are used to manage stack frames and the processor will freak out if this gets messed up.
You don’t need to set
fav_numberto a specific number for this task; anything that changes its value is fine.For that task it was easy to type input directly into
./buffer, but if we want more control over what we write this approach is incredibly inconvenient. Because we are providing a string, the program is encoding the characters we input into ASCII character codes for each byte. This means that in order to write specific numeric byte values to memory, we would have to map our characters to bytes with an ASCII table.To make life easier, we provide a program
exploit.cthat generates a particular binary output string and writes it tostdout. This string can contain non-printable characters! It’s default behavior is to print 32 bytes of all zeroes.You can compile the helper program with
make exploit. You can compile and runexploitwith its output sent directly into the stdin ofbufferwith the commandmake do_hack.Your computer (and thus, your course VM) uses a 64 bit architecture with little-endian data representation. That means that if we have a 4-byte integer in memory, it will be stored with the least significant bytes first:
Keep this in mind when writing to memory!
Task: Use the
exploitprogram to cause a buffer overflow that changesfav_numberto 131 at runtime. The program should not segfault.Hint:
As soon as the newline character appears
getswill stop reading data and add the null terminating character to the buffer. The byte that represents newline in ASCII is 0x0a.The decimal number 131 is 0x83 in hexcadecimal.
It might also be helpful to look at the bytes you are writing in GDB. The gdb examine utility might come in handy. The syntax for this command is
x/(number)(format)(unit size). So, if we wanted to print out the 32 bytes of memory at the address ofbufas hexadecimal bytes the command would be:x/32xb &bufA good way to tackle this problem if you get stuck is to use GDB to step through
foo()and examine the buffer memory addresses. Look for the number 12 (0x0c)! You can format your exploit according to the memory dump.To pipe your exploit to GDB you simply run
gdb bufferand then run within gdb withr < exploit.txt(be sure you’ve written the exploit with the most up to date sequence of bytes!). You can create anexploit1.txtfile with the contents of your exploit with the commandmake exploit_text1, which dumps the output of./exploitinto a the text file.Once you have your exploit working, run
make exploit_text1. This will write the current contents of your exploit buffer into a file exploit1.txt. If you want to verify that this worked correctly, you make run./buffer < exploit1.txt. This should give the same output asmake do_hack.It is important that you do this: we will use your exploit1.txt file for the checkoff!
The x86-64 Stack
In order to understand why the next part of this lab works the way it does, it is important to understand the x86 call stack. A call stack memory organization that enables function calls and local variable access with automatic lifetime.
If you feel comfortable with this from lectures, feel free to directly move on to the buffer overflow. If you’re not sure, you may want to go through some or all of the walkthrough below!
Keep in mind that the stack grows downward in memory! The “top” of the stack is the lowest memory address in the stack.
Walk through the x86-64 Call Stack.
We are going to track an x86 call stack through a sequence of function calls. Consider the following code snippet (found in
example.c) as an example:#include <stdio.h> void bar(int a) { int b = 8; printf("%d\n",a + b); } void foo(int a) { bar(a); } int main() { int a = 8; foo(a); }The compiled assembly for these functions is given below (courtesy of objdump):
Assembly code
000000000000064a <bar>:
 64a:	55                   	push   %rbp
 64b:	48 89 e5             	mov    %rsp,%rbp
 64e:	48 83 ec 20          	sub    $0x20,%rsp
 652:	89 7d ec             	mov    %edi,-0x14(%rbp)
 655:	c7 45 fc 08 00 00 00 	movl   $0x8,-0x4(%rbp)
 65c:	8b 55 ec             	mov    -0x14(%rbp),%edx
 65f:	8b 45 fc             	mov    -0x4(%rbp),%eax
 662:	01 d0                	add    %edx,%eax
 664:	89 c6                	mov    %eax,%esi
 666:	48 8d 3d d7 00 00 00 	lea    0xd7(%rip),%rdi        # 744 <_IO_stdin_used+0x4>
 66d:	b8 00 00 00 00       	mov    $0x0,%eax
 672:	e8 a9 fe ff ff       	callq  520 <printf@plt>
 677:	90                   	nop
 678:	c9                   	leaveq
 679:	c3                   	retq

000000000000067a <foo>:
 67a:	55                   	push   %rbp
 67b:	48 89 e5             	mov    %rsp,%rbp
 67e:	48 83 ec 10          	sub    $0x10,%rsp
 682:	89 7d fc             	mov    %edi,-0x4(%rbp)
 685:	8b 45 fc             	mov    -0x4(%rbp),%eax
 688:	89 c7                	mov    %eax,%edi
 68a:	e8 bb ff ff ff       	callq  64a <bar>
 68f:	90                   	nop
 690:	c9                   	leaveq
 691:	c3                   	retq

0000000000000692 <main>:
 692:	55                   	push   %rbp
 693:	48 89 e5             	mov    %rsp,%rbp
 696:	48 83 ec 10          	sub    $0x10,%rsp
 69a:	c7 45 fc 08 00 00 00 	movl   $0x8,-0x4(%rbp)
 6a1:	8b 45 fc             	mov    -0x4(%rbp),%eax
 6a4:	89 c7                	mov    %eax,%edi
 6a6:	e8 cf ff ff ff       	callq  67a <foo>
 6ab:	b8 00 00 00 00       	mov    $0x0,%eax
 6b0:	c9                   	leaveq
 6b1:	c3                   	retq
 6b2:	66 2e 0f 1f 84 00 00 	nopw   %cs:0x0(%rax,%rax,1)
 6b9:	00 00 00
 6bc:	0f 1f 40 00          	nopl   0x0(%rax)
How we got this assembly
gcc -O0 example.c -o example && objdump -d exampleDon’t worry if you don’t understand everything that is going on in the assembly code! Notice though that certain registers are frequently used in similar ways, especially at the start and end of function code.
At any given point, the execution of a computer program can be entirely described by the values within 3 registers
%rbp: 64-bit address in the stack segment that is the base of the current stack frame (a.k.a. base pointer).%rsp: 64-bit address in the stack segment that is the top of the current stack frame (a.k.a. stack pointer)%rip: 64-bit address in the text segment that is the address of the next instruction to be executed (a.k.a. instruction pointer).Between the values in
%rbpand%rspwe know the location of the current stack frame (and therefore the local variables and arguments available to us) and with the value in%ripwe know what instruction we’re executing.Note: When an x86 CPU performs a
pushinstruction the value in%rspis automatically decremented by the size of the data pushed. Thepopinstruction automatically increments the value in%rsp. In effect, these two instructions grow and shrink the current stack frame.Everytime the computer executes a normal instruction
%ripgets automatically incremented to the next instruction. Certain special instructions can “jump” or put an address into the instruction pointer that is not the next sequential address. This is how functions and branch logic (e.g.ifandforstatements) work at the register level.The x86 calling convention uses two special jumping instructions:
call <addr>. The assembly instruction for calling a function. It storesaddrinto%ripto begin executing that part of the text section. This function also pushes the current instruction pointer (%rip) onto the stackretThe assembly instruction for returning from a function. This instruction pops the top of the stack into%rip.Note: The “q” suffix in x86 assembly means “quad”. All this does is specify that the operation is performed on a 64 bit operand. For instance
callqmeans call a function with a 64 bit address.Looking at the instruction at address 0x00000000000006a6 we see a call to foo. (some investigation of the assembly code will reveal that 0x000000000000067a is the address of
fooin text)6a6: e8 cf ff ff ff callq 67a <foo>Before this instruction,
%ripcontained the address of the next instruction (0x00000000000006ab) and the stack looked something like thisAfter this instruction
%ripcontains the address offoo(0x000000000000067a) and the old value in%ripwas pushed onto the stackThe next instruction we execute will be at the address of
fooin the text segment.67a: 55 push %rbpThis instruction simply pushes the current
%rbpvalue onto the stack. Now the value at the top of our stack is an address that points to the current base of our stack (along with%rbp)pushis not a jumping instruction so the next instruction we execute will be the next sequential instruction at address 0x000000000000067b67b: 48 89 e5 mov %rsp,%rbpThis instruction updates the base pointer by moving the current stack pointer value into the base pointer. Now the value on the top of the stack is the “old” base pointer from main and the current base pointer points to the top of the stack.
We are almost done setting up the stack frame for
foo(). All we need is some allocated space to deal with local variables. Our next instruction does exactly this67e: 48 83 ec 10 sub $0x10,%rspThis has moved the top of our stack 0x10 (or 16 in decimal) bytes down and therefore allocated 0x10 bytes.
The reason we need 0x10 of space is because of alignment. We only need 0x4 bytes to store the
intargument on the stack but because of some x86_64 shenanigans the stack pointer must be 16 byte aligned. (“ABI” stands for application binary interface for those who clicked the link)After this instruction our stack looks like this
At this point in the execution we have the stack frame established and we perform a task. The only task that
foo()does is callbar(), we see this in the instruction at address 0x000000000000068a68a: e8 bb ff ff ff a callq 64a <bar>At this point the stack would undergo the same process as above but instead starting from the foo() stack frame and allocating 0x20 bytes instead of 0x10:
Now we’ve built the stack for the functions in our program… but how about cleanup?
Before the function
bar()returns it uses theleaveqinstruction.leaveqis a convienient instruction that optimizes/condenses the collapse of a stack frame. The effect of theleaveqinstruction is exactly equivalent to the following sequence of instructions.mov %rbp,%rsp pop %rbpThis first moves the current base pointer value into the stack pointer. Effectively resetting any of the space subtracted for local variables when we set up the stack frame.
Next we pops the value at the top of the stack into
%rbp, restoring the base pointer to the base pointer offoo()After the
leaveqinstruction we are ready to go home and callretq. This pops the address of the next instruction infoo()after the call tobar()into%rip. Now we are executing instructions infoo()and the stack frame we have is exactly that offoo()This is the call stack mechanism by which functions call and return. Hopefully it is clear how scope is created and removed from the stack and how it is possible to move into a previous stack frame.
Overflow 2:
Note that you must develop your exploit for this part of the lab inside your course VM. If you build the buffer executable outside the course VM, differing compiler and linker versions may put the
hack()function at a different address in memory than they would in the VM and on the grading server, and yourexploit2.txtfile will no longer work on the grading server.Now let’s hack the call stack of our
bufferprogram. We have written an unused functionhack()in thebuffer.cfile, and your job is to somehow execute this function at runtime without putting an invocation in the program code.You can check if your solution works by running
make do_hackand checking if the hacking text is printed.Task: Use the
exploitprogram to cause a buffer overflow that results in the execution of thehack()function. Again, this should not cause the program to segfault.Hint:
Consider targeting the
retqinstruction to load a particular address into%rip. From where doesretqtake a value? If you don’t know the answer to this question, read the walk through of the x86-64 call stack.Once you have your exploit working, run
make exploit_text2. This will write the current contents of your exploit buffer into a file exploit2.txt. If you want to verify that this worked correctly, you make run./buffer < exploit2.txt. This should give the same output asmake do_hack.It is important that you do this: we will use your exploit2.txt file to check off the lab.
Handin instructions
Turn in your code by pushing your git repository to
github.com/csci1310/cs131-s20-labs-YOURNAME.git.Then, head to the grading server. On the “Labs” page, use the “Lab 3 checkoff” button to check off your lab.