Homework 4: Data Drama

Due: Wednesday February 19, 2020 at 9:00PM EST.
Setup and Handin
Setup
- This is the link template for this homework! One file is for your assignment, and one is for your testing.
Handin
- Download both your solutions file and your testing file and make sure they are called
hw4-code.arr and hw4-tests.arr respectively. Hand in your work on Gradescope, making sure to use your anonymous account.
Remember your resources!
The Assignment
Part 1: Even more ads!
Part 1A: Multiple ads
Note: Remember to use the CS0111 Table documentation (linked in Setup and Handin), not the official documentation.
Let’s check back in on Giselle in dandy ol’ Oatman! Last week, Giselle was getting hip on targeted ads, but now she wants to master targeted adds (this is a pun). In other words, she wants to be able to handle multiple ads, and she needs your help!
In the last homework, we handled a growing collection of ad features by creating a single-row table with the data for an ad. This week, we want to handle a larger number of ads themselves, by having a multi-row table of ads.
Since there will be many ads, we’ll also store the ad text in our table. We’ll also give each ad an ID number that we can use for reference. ID numbers are unique, but besides that, they can be any number.
In hw4-tests.arr, there is a blank table called ad-info with the header we need for ads. ad-id is a Number and ad-text is a String.
Task: Add rows to ad-info to get a sample table with up to 8 ads to use in testing.
Note: You may end up changing these contents as you understand the questions you’ll be testing.
Now we want to identify the ads to display to a given person.
Task: Write comprehensive tests for the function called age-based-ads in hw4-tests.arr. This function takes in the age of a person and a table of ads and returns a table with the same columns and all the ads whose target age is within 5 years of the input age.
If the target age is blank for any of the ads in the input Table, the ad should be included in the output table. We will be using the same notion of a “blank” cell as Homework 3. You can assume that the input age (not in the Table) will never be a blank value.
Use ad-info for your tests, and edit or add rows to help you hit all your edge case tests.
Task: Implement age-based-ads in hw4-code.arr. Feel free to copy any functions from previous homeworks into this document, but make sure to edit them accordingly.
Giselle also wants know if her advertising skills are up to par with the competition. To do this, she wants to check whether she has a good collection of ads for various demographics. She wants to visualize two aspects of the collection of ads:
- The distribution of ads across the following age groups: 30 and under, 31-40, 41-50, 51-60, and older than 60
- The proportion of ads for each group of mobile-phone users (never, sometimes, frequently)
Task: Develop the functions show-age-distrib and show-mobile-proportions in hw4-code.arr to create the corresponding plot images. These functions should take in a Table and produce a single Image that displays an an appropriate plot or chart. Like before, please refer only to the CS111 Table documentation to write functions to visualize the data.
Note: You don’t need to test the plotting functions.
Hint 1: Try first playing around with some of the helper functions in the Table documentation that might help you get the arguments you need for the plot/chart function you choose.
Hint 2: Look at the count builtin function. What does the table produced by the count function look like? What are the names for its columns?
Giselle maintains a separate table that shows how much revenue each ad generated in the last month. This table has two columns: one for the ad ID (a Number) and one for the revenue (a Number). It could look like this:
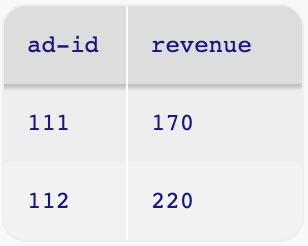
Giselle has asked you to produce a scatterplot that maps the ad IDs against the revenue. Do not actually produce this scatterplot, but consider: What useful information would such a scatterplot provide?
Task: Justify your answer in a sentence or two under your implementation of show-mobile-proportions.
Now, Giselle wants to generate a revenue report for a given ad ID. The report should be a String containing both the revenue and the text of the ad, such as: "Pony Express in operation generated 170" (where the part before “generated” is the text of the ad and the number after “generated” is the revenue for the ad).
Task: Complete the ad-report function to accomplish this task. ad-report should take in a Number representing the ID to find, a Table of the same format as ad-info, and a Table representing the revenue for each ad ID. It should return a String.
Part 2: Malaria
Perhaps the wildest thing about the Wild West is just how unpredictable it is. Giselle’s advertising technology becomes so advanced that she accidentally develops time travel, and after tinkering with her tech, you find yourself in the following situation:
Annie, Monica, and Credo are malaria researchers with data science skills, and they have come to your village. They’ve been recording where people live and whether they have contracted malaria. They want us to use their data to decide whether to give someone a net, and they need your help!
With the ad example, we used a Table to organize a lot of data that someone wanted to search either to find ads or to report on them. In other settings, we might want to use a Table to gather observations from an experiment and use data about previous observations to guide future decisions (this is the essence of machine learning).
Annie, Monica, and Credo have access to data including distance from a lake (a Number), individuals’ age (a Number) and whether they are pregnant (a Boolean). Living within 20 yards of a lake is likely to increase malaria risk; children and pregnant people both have less-than-average immunity to malaria and are therefore more susceptible.
In hw4-code.arr, there is a detailed malaria Table called MALARIA-DATA defined at the top of the document, which includes a column for if the individual contracted malaria. Individuals in this table are between 0 and 80 years old and they live between 5 and 300 yards from a lake.
Task: Fill in the function similar-people, which takes in the distance to lake, age, and pregnancy status for a person and a Table of data like MALARIA-DATA. It produces a Table of the individuals who are similar to the person we are checking: distance within 20 yards, age within 5 years, and pregnancy status the same. You should create smaller tables with a similar format to MALARIA-DATA to test this function.
Task: Fill in the function give-net, which takes in a Table of similar individuals (something like the output from similar-people) and decides based on this past data whether to give them a net. Specifically, if the number of people in this Table who got malaria is at least as large as the number who did not, return true (we’ll give them a net). Otherwise, return false. If there are no similar people, we don’t have enough information, so we don’t want to risk it: return true and give the individual a net.
Note: For testing, think about how you could easily produce test inputs for this function: what other function can you use to easily create various inputs?
While this is a very simple notion of what machine learning does, it is enough to give you the core idea: we have data on what has happened in the past, and we use statistics about it to make decisions about new situations. If you took a machine learning class, you would learn how to handle more complex notions of similarity between old and new cases, and more nuanced algorithms for deciding what to do based on the data. Still, you have learned enough in 111 so far to see the basic components of such algorithms.
Theme Song
Ghost Riders in the Sky by Johnny Cash
Brown University CSCI 0111 (Spring 2020)
Do you have feedback? Fill out this form.
Homework 4: Data Drama
Due: Wednesday February 19, 2020 at 9:00PM EST.
Setup and Handin
Setup
Handin
hw4-code.arrandhw4-tests.arrrespectively. Hand in your work on Gradescope, making sure to use your anonymous account.Remember your resources!
Tabledocumentation)The Assignment
Part 1: Even more ads!
Part 1A: Multiple ads
Note: Remember to use the CS0111
Tabledocumentation (linked in Setup and Handin), not the official documentation.Let’s check back in on Giselle in dandy ol’ Oatman! Last week, Giselle was getting hip on targeted ads, but now she wants to master targeted adds (this is a pun). In other words, she wants to be able to handle multiple ads, and she needs your help!
In the last homework, we handled a growing collection of ad features by creating a single-row table with the data for an ad. This week, we want to handle a larger number of ads themselves, by having a multi-row table of ads.
Since there will be many ads, we’ll also store the ad text in our table. We’ll also give each ad an ID number that we can use for reference. ID numbers are unique, but besides that, they can be any number.
In
hw4-tests.arr, there is a blank table calledad-infowith the header we need for ads.ad-idis aNumberandad-textis aString.Task: Add rows to
ad-infoto get a sample table with up to 8 ads to use in testing.Note: You may end up changing these contents as you understand the questions you’ll be testing.
Now we want to identify the ads to display to a given person.
Task: Write comprehensive tests for the function called
age-based-adsinhw4-tests.arr. This function takes in the age of a person and a table of ads and returns a table with the same columns and all the ads whose target age is within 5 years of the input age.If the target age is blank for any of the ads in the input
Table, the ad should be included in the output table. We will be using the same notion of a “blank” cell as Homework 3. You can assume that the input age (not in theTable) will never be a blank value.Use
ad-infofor your tests, and edit or add rows to help you hit all your edge case tests.Task: Implement
age-based-adsinhw4-code.arr. Feel free to copy any functions from previous homeworks into this document, but make sure to edit them accordingly.Part 1B: Visualization & data extraction
Giselle also wants know if her advertising skills are up to par with the competition. To do this, she wants to check whether she has a good collection of ads for various demographics. She wants to visualize two aspects of the collection of ads:
Task: Develop the functions
show-age-distribandshow-mobile-proportionsinhw4-code.arrto create the corresponding plot images. These functions should take in aTableand produce a singleImagethat displays an an appropriate plot or chart. Like before, please refer only to the CS111 Table documentation to write functions to visualize the data.Note: You don’t need to test the plotting functions.
Hint 1: Try first playing around with some of the helper functions in the Table documentation that might help you get the arguments you need for the plot/chart function you choose.
Hint 2: Look at the
countbuiltin function. What does the table produced by thecountfunction look like? What are the names for its columns?Giselle maintains a separate table that shows how much revenue each ad generated in the last month. This table has two columns: one for the ad ID (a
Number) and one for the revenue (aNumber). It could look like this:Giselle has asked you to produce a scatterplot that maps the ad IDs against the revenue. Do not actually produce this scatterplot, but consider: What useful information would such a scatterplot provide?
Task: Justify your answer in a sentence or two under your implementation of
show-mobile-proportions.Now, Giselle wants to generate a revenue report for a given ad ID. The report should be a
Stringcontaining both the revenue and the text of the ad, such as:"Pony Express in operation generated 170"(where the part before “generated” is the text of the ad and the number after “generated” is the revenue for the ad).Task: Complete the
ad-reportfunction to accomplish this task.ad-reportshould take in a Number representing the ID to find, aTableof the same format asad-info, and aTablerepresenting the revenue for each ad ID. It should return aString.Part 2: Malaria
Perhaps the wildest thing about the Wild West is just how unpredictable it is. Giselle’s advertising technology becomes so advanced that she accidentally develops time travel, and after tinkering with her tech, you find yourself in the following situation:
Annie, Monica, and Credo are malaria researchers with data science skills, and they have come to your village. They’ve been recording where people live and whether they have contracted malaria. They want us to use their data to decide whether to give someone a net, and they need your help!
With the ad example, we used a
Tableto organize a lot of data that someone wanted to search either to find ads or to report on them. In other settings, we might want to use aTableto gather observations from an experiment and use data about previous observations to guide future decisions (this is the essence of machine learning).Annie, Monica, and Credo have access to data including distance from a lake (a
Number), individuals’ age (aNumber) and whether they are pregnant (aBoolean). Living within 20 yards of a lake is likely to increase malaria risk; children and pregnant people both have less-than-average immunity to malaria and are therefore more susceptible.In
hw4-code.arr, there is a detailed malariaTablecalledMALARIA-DATAdefined at the top of the document, which includes a column for if the individual contracted malaria. Individuals in this table are between 0 and 80 years old and they live between 5 and 300 yards from a lake.Task: Fill in the function
similar-people, which takes in the distance to lake, age, and pregnancy status for a person and aTableof data likeMALARIA-DATA. It produces aTableof the individuals who are similar to the person we are checking: distance within 20 yards, age within 5 years, and pregnancy status the same. You should create smaller tables with a similar format toMALARIA-DATAto test this function.Task: Fill in the function
give-net, which takes in aTableof similar individuals (something like the output fromsimilar-people) and decides based on this past data whether to give them a net. Specifically, if the number of people in thisTablewho got malaria is at least as large as the number who did not, returntrue(we’ll give them a net). Otherwise, returnfalse. If there are no similar people, we don’t have enough information, so we don’t want to risk it: returntrueand give the individual a net.Note: For testing, think about how you could easily produce test inputs for this function: what other function can you use to easily create various inputs?
While this is a very simple notion of what machine learning does, it is enough to give you the core idea: we have data on what has happened in the past, and we use statistics about it to make decisions about new situations. If you took a machine learning class, you would learn how to handle more complex notions of similarity between old and new cases, and more nuanced algorithms for deciding what to do based on the data. Still, you have learned enough in 111 so far to see the basic components of such algorithms.
Theme Song
Ghost Riders in the Sky by Johnny Cash