The Thread Debugger is a graphical debugger intended for the purpose of debugging multithreaded code. It has the usual debugger features: stepping through code, setting breakpoints, and examining variable values and state of the program (backtraces and such).
However, the multithreaded component is a key portion of the project. The debugger must be able to simultaneously show and debug several threads simultaneously, with all the features of the single-threaded debugger.
The debugger will use the existing debugging capabilities of GDB. The main difficulty will be in providing an effective, easy-to-use front-end.
We will write this front-end in OCaml. OCaml's features and language design make it the best choice for this project. This decision was made based on a number of factors:
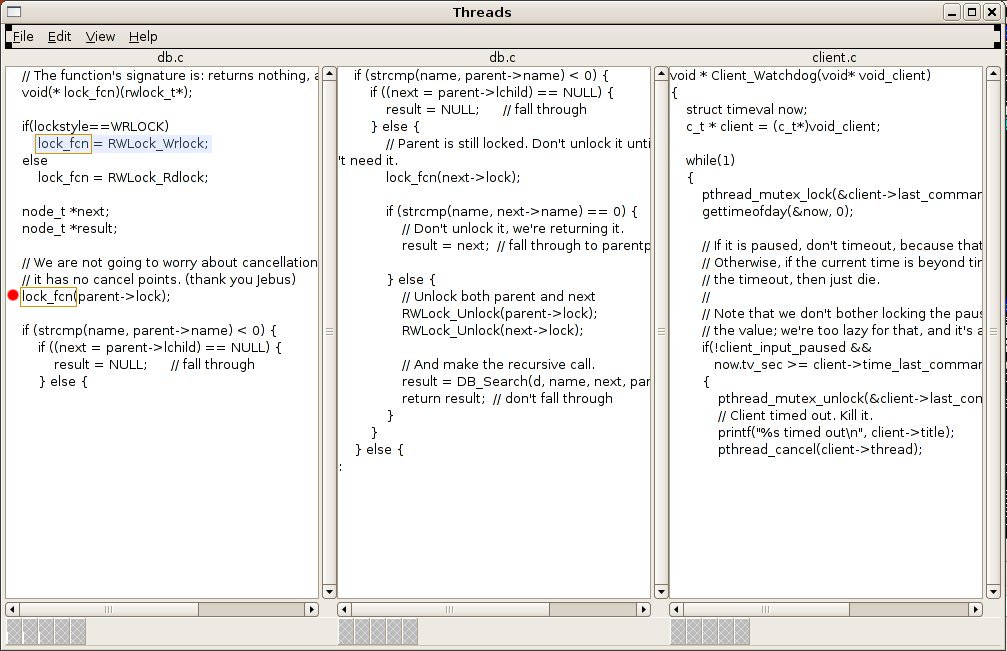
The primary user interface feature will be a debugger pane. There can be several debugger panes visible at once -- one for each running thread, tiled horizontally, down to a minimum width for a single pane.
The primary feature of a pane is the code display, showing the source file for the running code. If the code is paused, the line of code that execution is stopped at is highlighted. The user may click in the margin to set a breakpoint in the code, and a breakpoint icon appears wherever there is a breakpoint.
Panes also have a toolbar of controls at the bottom. Each thread has Break, Continue, Step, Next, and Finish buttons, which do the usual GDB thing. The pane may also have several other status icons indicating thread status -- running, blocked on a synchronization device, in a system call, and so on. These status icons are modular and can be easily added or customized by technical users.
When a thread stops, a mini-pane extends from the bottom of the code window displaying information about the thread: backtrace, local variables, and so on. This mini-pane disappears when the user interacts with the pane, but it can be redisplayed through a button on the pane's toolbar.
The system will have features for easily displaying variable values and interacting with gdb directly. As the user mouses over symbols in the code, the debugger highlights features of interest related to that symbol. For example, when the user mouses over a variable, the debugger highlights other instances of that variable in the code; when the user mouses over a delimiter, the debugger highlights the matching delimiter. When the user clicks a variable, a mini-pane displays the variable's value. The user can click a toolbar button to enter a command mode where they can enter a command to GDB and get the result.
There are many keyboard shortcuts provided for expert users. The UI maintains the notion of an active thread, to which keyboard input is directed. Users can use shortcuts to activate almost all UI capabilities (for instance, pressing 'n' performs the "next" action on the current thread).
Performance. The graphical debugger must not perform significantly more slowly than GDB. While the GUI will have some overhead over GDB's text UI, tasks must not seem slower to the user.
Reliability. The debugger must not crash or exit unexpectedly, even on unexpected input from the user or from GDB.
Ease of use: A programmer with significant GDB experience or significant graphical debugger experience must be able to sit down in front of the debugger with no documentation or help and become proficient (able to do common debugging tasks) within ten minutes.
Portability: The program MUST build and run on Linux on all architectures, and SHOULD build and run on all operating systems where GDB is supported.
The program MUST:
The program SHOULD:
If GDB doesn't have sufficient thread support built-in, the functionality of the program could be reduced. (For example, it is unclear whether one thread can be running while others are stopped.) This risk could be reduced by researching the thread capabilities of GDB in detail. Few people use the multithreading features of GDB, and those that do use it from a text console, so it's important to investigate them. If it turns out that something important isn't implemented, it might be necessary to modify GDB.
The usability of having several thread panes visible at once is untested. The current belief is that it would be workable, but if it turns out that having multiple thread views simultaneously doesn't work from a usability perspective (because, for example, there's not enough room horizontally to see the code), then more work will need to be done on reworking the interface paradigm.